

From election upsets to climate chaos, rolling the dice helps us appreciate the odds
- Written by: Michael J. I. Brown, Associate professor in astronomy, Monash University
“He [God] does not play dice”, quipped Albert Einstein, but for mortals chance is part of life. We cannot experience, measure and predict with absolute certainty. We may win a prize in a Christmas raffle. There’s also a small but real chance of being struck by lightning.
Statistics enables understanding of numerical data, including probabilities. But it is also a subject worthy of university degrees and entire careers. Statistics can be complex, and it can be ignored and misunderstood.
But a simple dice can provide a gateway to basic statistics. And not just your chance of rolling two sixes. A dice can tell you about opinion polls, risk, wages and even starlight.
Roll a dice
You’re probably familiar with a six-sided dice – a cube with sides numbered from one to six. The chance of rolling each number is one in six, or 16.67%. Conversely, the chance of not rolling a six is five in six, or 83.33%. In other words, you could roll a six but more often you won’t. Easy? Perhaps not.
Back in 2016, American statistician Nate Silver, famed for his election forecasts, gave Donald Trump a 28.6% chance of victory. Obviously his prediction strongly favoured Hillary Clinton, but didn’t rule out Trump. In fact, the odds of a Trump win were better than the odds of rolling a six.
If you had to lay money on rolling a six, you would perhaps bet against it but not be unduly surprised if you lost. And yet many people believe Trump’s victory proved Nate Silver “wrong”.
Our appreciation of odds can also be distorted when risk is involved. So-called “lukewarmers” acknowledge climate change is real, but consistently favour the minority of projections that result in least warming and smallest costs. Hoping for the best is understandable, but should you bet serious money on rolling a six? Again, no.
Simple statistics can confound. We can be handed the numbers, but gut feeling may distort our appreciation of them. We don’t see the dice in our hand.
Read more: The seven deadly sins of statistical misinterpretation, and how to avoid them
Averages, midpoints and wages
If we roll a dice many times over, we know we aren’t going to roll a six every time.
The average value of a dice is 3.5 (21 spots divided by 6 sides). This value is also the “midpoint”; we would expect half the rolls to be below it, and half the rolls to be above it.
While the average and midpoint are often similar, they don’t have to be. Get a marker pen and replace the number 6 with 12. Now the average value of rolls with this dice is 4.5.
But what about the midpoint for our vandalised dice? It hasn’t budged from 3.5 – half the rolls are below 3.5 and half are above it. These differences turn up elsewhere, and they can absolutely matter.
Lets look at the weekly earnings of full-time Australian employees. In 2018 the midpoint was A$1,500, while the average was A$1,730. Ten per cent of employees earned A$925 or less, whereas 10% earned A$2,771 or more. You can boost the earnings of some employees and move the average, while the earnings for most employees and the midpoint remain unchanged.
So is an average actually useful? Absolutely, but it doesn’t give a full picture. Average earnings may grow, but not everyone may share that growth.
 What are the earnings of typical Australians? Before answering that question, you may want to know about averages and midpoints.
Will/flickr
What are the earnings of typical Australians? Before answering that question, you may want to know about averages and midpoints.
Will/flickr
Noise and light
With a good six-sided dice I can determine the average and midpoint trivially with a calculator. But what if I wasn’t absolutely sure the dice was fair? How many rolls would it take to check?
I can try to measure the average by rolling the dice many times and seeing how it compares with the expected value of 3.5. I rolled a dice 24 times and initially measured an average value of 3.79. I then repeated the experiment and got averages of 3.62, 3.13, 3.59, 3.75, and 3.25.
In this instance I had a perfectly good dice, but my measurements of the average are noisy. When I roll a dice 24 times, I don’t get four of each number every time. Sometimes I roll a few more sixes, other times a few less. It is just the nature of chance.
This type of noise can turn up in all sorts of places. For example, when I observe distant galaxies there may be a 1% chance of detecting a light particle in a given millisecond. If I take a series of ten-second exposures, I may detect 110 light particles in the first exposure, then 92 in the next, then 108, and then 112.
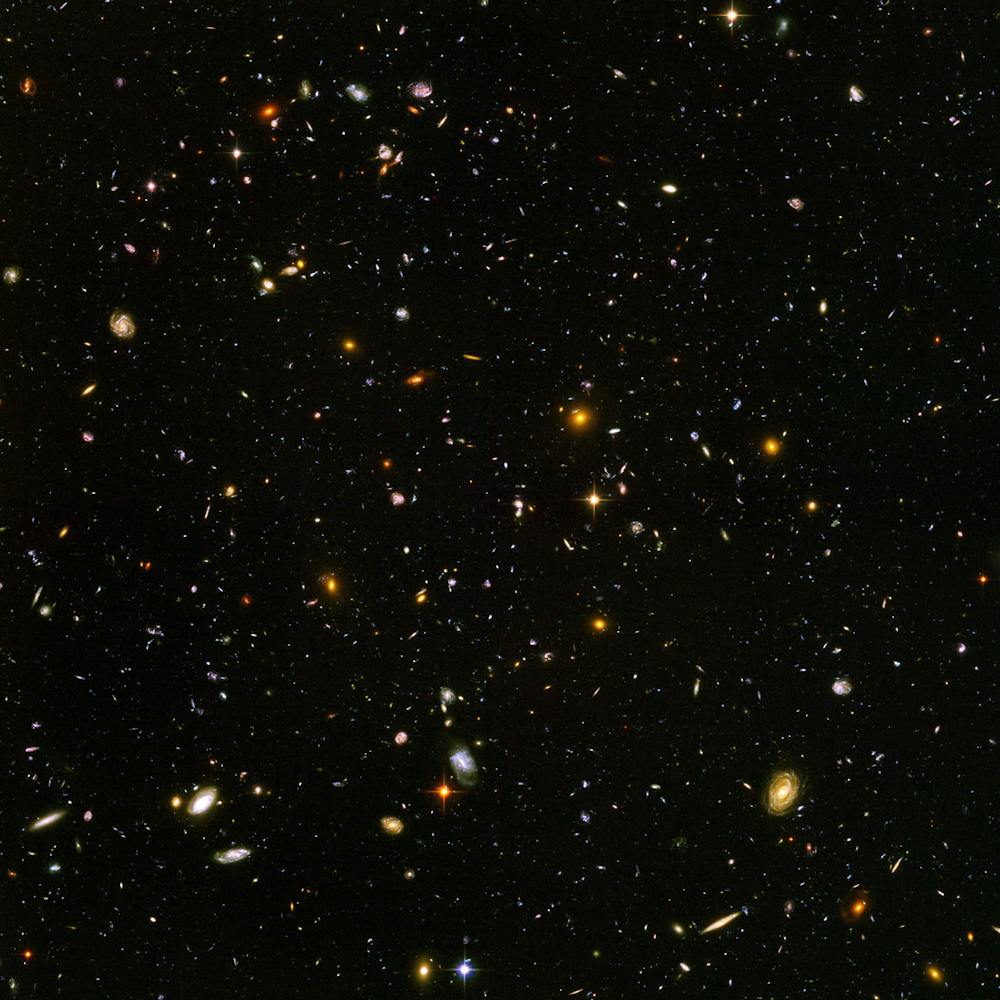 The arrival of photons from distant galaxies exhibits random fluctuations.
NASA, ESA, S. Beckwith (STScI), HUDF Team
The arrival of photons from distant galaxies exhibits random fluctuations.
NASA, ESA, S. Beckwith (STScI), HUDF Team
These fluctuations are not the result of defects in my equipment or interference from our atmosphere – this noise is inherent to measuring light from stars and galaxies. Such noise is inherent to many scientific endeavours. Indeed, noise not behaving as expected (or being absent) is a great way of detecting research fraud.
Read more: Election explainer: what are the opinion polls and how accurate are they?
Polls and herds
Political opinion polls should also show noise. If two political parties each have 50% of the vote, and we poll 1,800 people, there is a 40% chance we will measure one of the parties as having 51% (or more) of the vote. In other words, polls of 1,800 people should randomly fluctuate by roughly 1%.
In the runup to the 2019 Australian federal election, these random fluctuations did not happen. Election analyst Kevin Bonham and Nobel Laureate Brian Schmidt both noticed that opinion polls were not showing the expected noise. Instead, their results were strangely close to each other – a phenomenon called “herding”.
Somehow, the polling was being tweaked to remove fluctuations that are intrinsic to the data, and this can introduce very serious errors. In the end the opinion polls predicted a Labor victory, but it was the Coalition that won .
Unfortunately, Australian media and politics has a reputation for being poll-obsessed. A half-percent shift in polls is interpreted as meaningful rather than just meaningless noise.
If such noise is being interpreted as the result of performance or policy, how Australia is governed may be compromised by statistical naivety. We may crave absolute certainty, but sometimes things really do just hinge on chance.
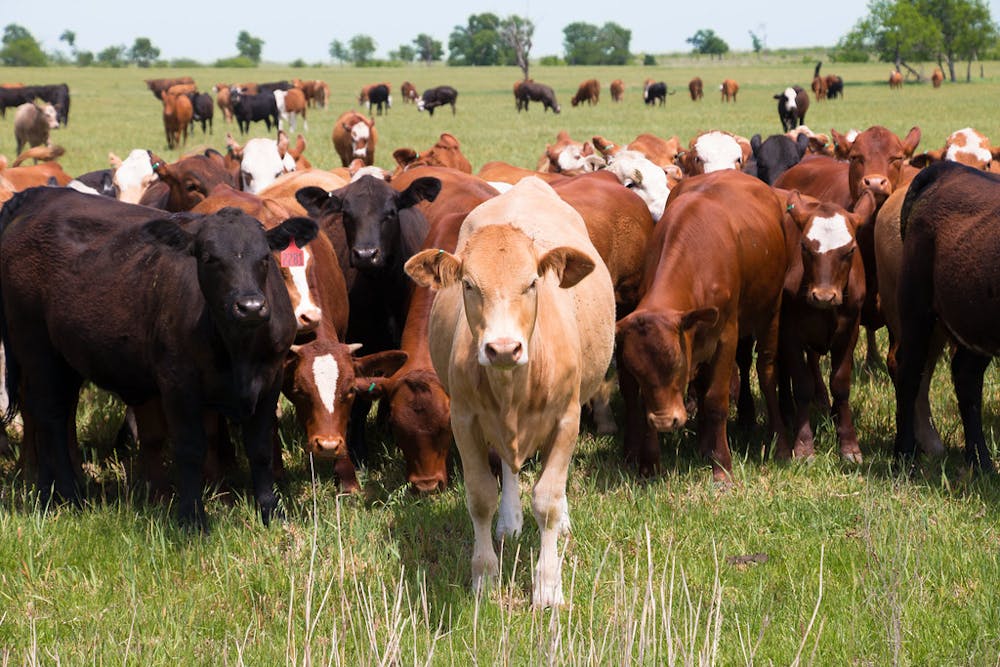 Opinion polls sometimes suspiciously herd together, which is counter to good statistics.
Rockin'Rita/flickr
Opinion polls sometimes suspiciously herd together, which is counter to good statistics.
Rockin'Rita/flickr
Authors: Michael J. I. Brown, Associate professor in astronomy, Monash University


