A Tale of Performance Testing
- Written by Josh Bassett, Data Platform Technical Lead, The Conversation
At The Conversation we’ve recently been working hard at migrating one of our web applications to Amazon Web Services (AWS). The exact architecture we’re running on AWS is a whole blog post in itself, but suffice it to say that it is quite different to our current architecture, which runs everything on a bare-metal host.
Testing with Real-World Traffic
Rather than just cowboy the app across to the cloud and hope for the best, we decided that the best thing to do was evaluate the performance of our new server running on AWS for a period, before eventually going live. To make the test as realistic as possible, we wanted to hit it with real-world traffic. But rather than flip the switch on our new server and start serving requests for real, we only wanted to send it a copy of our production traffic. The current server would still be responsible for handling all our users’ requests. This meant that we would need a way to mirror the production traffic from our current server to the new server, preferably without any downtime or configuration changes.
GoReplay
After looking at many possible solutions I stumbled across GoReplay, which turned out to be the perfect tool for the job. It allows you to intercept and relay any traffic on a local TCP socket to a remote web server. Importantly, you don’t have to make any changes to your environment other than installing the tool itself.
For example, to relay any request on local TCP socket 9292 to a remote web server:
> goreplay --input-raw :9292 --output-http "http://my-server.example.com"
Don’t Believe Everything You See
Using GoReplay I had our current production server relaying traffic to the new server running on AWS. Everything was going smoothly until I noticed that the performance on the new server was absolutely terrible.
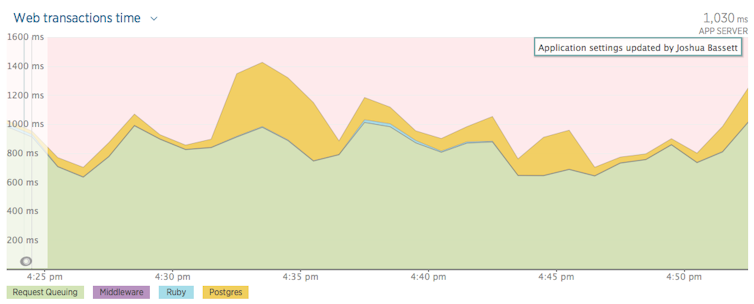
We use New Relic to monitor our application performance, and the performance graph was telling me that the new app server was consistently spending nearly a second just queuing the requests. This was all before our Ruby app server had even fired off a single query to the database! The total latency was over a second, even for simple requests. How could this be? It was incredibly disappointing to see such poor performance after painstakingly migrating our app to AWS.
 New Relic performance.
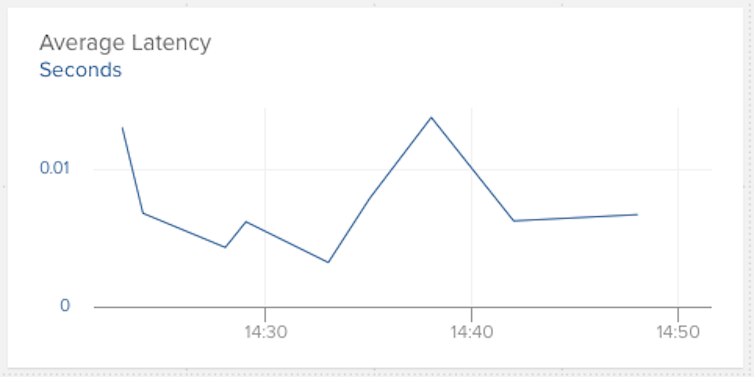
I started looking for more evidence to support the measurements I was seeing in New Relic. I noticed that the latency graph for our AWS load balancer was telling me a completely different story – it was showing me consistently fast performance (<10ms latency). How could they both be correct?
 Load balancer latency.
The final piece of evidence against the New Relic data was gleaned by running a request to our application health check from the CLI:
> curl -o /dev/null -s -w %{time_total} "http://my-server.example.com/health"
0.575593
This told me that even with the added latency between Australia and the US, I was still getting much lower latency than what I saw in New Relic. So why was New Relic wrong?
Beware Subtleties
Convinced that our New Relic data was inaccurate, I started digging for the source of the anomalies. After focusing on how New Relic actually calculates the “Request Queuing” metric I finally figured out the problem:
- When a request arrived on our current server, Nginx would set the
X-Request-StartHTTP header with the current timestamp. - Nginx would then proxy the request to our Ruby app server, listening on port 9292.
- GoReplay, also listening on port 9292, would relay the request (including all HTTP headers) to the new server.
- The new server would then process the replicated request.
- Finally, the New Relic agent running in our Ruby app server would happily forward the
X-Request-StartHTTP header, even though the timestamp was recorded on a different server.
So the huge amount of time spent queuing the request actually turned out to be bogus, all because I naively assumed that New Relic was receiving correct data. The answer turned out to be very simple: clear the X-Request-Start HTTP header before relaying the request.
> goreplay --input-raw :9292 --output-http "http://my-server.example.com" --http-set-header "X-Request-Start:"
That way New Relic wouldn’t think that the request was being “queued” the whole time it was being relayed from our current server to the new one.
What I Learned
Whenever you evaluate any change to your application, be it an infrastructure or code change, you need to be very careful that you’re always making an apples-to-apples comparison. You also need to have a hypothesis to test (e.g. I expect the performance should be better/worse/same), which will either be confirmed or denied by the measurements you make.
Like any good scientist, you can’t just blindly trust one line of evidence – make multiple measurements of the effect of your changes. Lastly, the more familiar you are with your data, the more honed your intuition will be should one of your measurements tell you lies.
Authors: Josh Bassett, Data Platform Technical Lead, The Conversation
Read more http://theconversation.com/a-tale-of-performance-testing-83158


