

Our cities are widening the divide between the well-off and the rest. How can we turn this damaging trend around?
- Written by: Somwrita Sarkar, Senior Lecturer in Design and Computation, University of Sydney
The “latte line” is the infamous, invisible boundary that divides Sydney between the more affluent north-east and the south-west. Historically, people north of the line enjoy better access to jobs and education, and can capitalise on rising property wealth. This has reinforced economic inequality.
Despite our image as a classless society, similar spatial divides have long marked Australia’s other capital cities as well. So are things getting better or worse?
We set out to answer this question by investigating neighbourhood population changes across Australia’s five largest cities – Sydney, Melbourne, Brisbane, Adelaide and Perth. We used census data to track patterns of wealth and disadvantage between 2011 and 2016. We looked at who moved in, out of or remained in each location, and who goes to work where.
We found clear evidence of social exclusion at work. These capital cities are becoming more segregated along socioeconomic lines. And the trend was worst in Sydney.
Measuring gentrification and exclusion
To see whether we could detect gentrification in action, we looked for evidence of lower-income people being displaced from well-located areas.
We were also interested in signs of the reverse. For instance, has the boom in apartments near transport and employment centres helped lower-income earners find more housing near their workplaces, counteracting spatial exclusion?
Using internal migration data from 2011 and 2016, we traced movement between locations using the Australian Bureau of Statistics (ABS) “Statistical Area Level 2” (SA2) – the smallest area for the release of full census statistics.
These localities also have Socio-Economic Indices for Areas (SEIFA) scores. This is a combined measure of socio-economic advantage and disadvantage, education, occupation and economic resources.
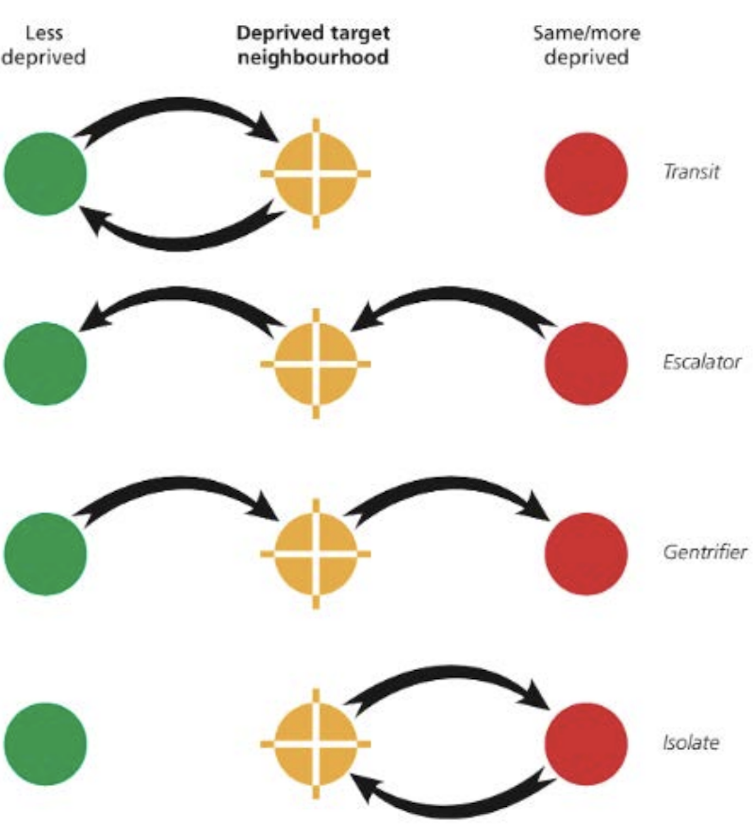
We classified every SA2 into one of four neighbourhood types:
escalator: people moving in come from SA2s with the same or lower SEIFA scores, and people moving out go to SA2s with higher SEIFA scores, so escalators signify upward social mobility
gentrifier: in-movers come from SA2s with higher SEIFA scores (more affluent areas) and out-movers go to SA2s with the same or lower SEIFA scores
isolate: in-movers and out-movers come from and go to SA2s with the same or lower SEIFA scores, so the movers have likely been “priced out” or excluded from other localities
transit: in-movers and out-movers come from and go to SA2s with higher SEIFA scores.

We counted the SA2s falling into each of these neighbourhood types. The results show clear, dynamic patterns of social exclusion along geographic lines.
In the most advantaged areas, isolate neighbourhoods dominate. This indicates lower–income earners have already been excluded from these locations.
By contrast, transit neighbourhoods cluster in more disadvantaged neighbourhoods. This suggests these locations may offer access to economic opportunity. But they are at risk of becoming gentrified, excluding and displacing lower-income residents.
Measuring access to jobs
Access to jobs is essential for economic opportunity. We measured connectivity to the main centres of employment at the SA2 level for all five cities, using ABS Census journey-to-work data .
Again, we found higher SEIFA-scoring neighbourhoods were better connected to employment centres than those with lower SEIFA scores. Higher-income earners can afford to live close to their workplaces. Lower-income workers can’t.
Housing and jobs create double disadvantage
The most advantaged households benefit from their high access to employment opportunities. This is reflected in high house prices and rents in those neighbourhoods. And that, in turn, reinforces patterns of household wealth, poverty and spatial segregation.
Our study revealed high-income and very-high-income earners are clustering in ever-tighter spatial groups. In effect, they live behind an invisible “neighbourhood exclusion barrier”.
Over time, moderate and low-income renters are displaced from these areas of affluence. Other lower-income earners can’t replace them as the housing has become too expensive. This effect persists despite the economic ties lower-income workers often have to these areas.
This results in a labour market where the highest earners are closest to centres of employment. Those on lower and moderate incomes are forced out to the city fringes and must travel more to get to work.
Residential exclusion and the employment connectivity divide combine to increase spatial inequalities in cities.
This is in addition to the inefficiencies created by the mismatch between the locations of jobs and housing.
So how do the cities compare?
Sydney emerged as the most segregated and unequal of the five cities. The latte line is getting stronger.
 The locations of the four neighbourhood (SA2 areas) types and their SEIFA status (blue is top 10% of scores) across Sydney. Note: blank areas are non-residential areas of extremely low population.
Authors, Spatial segregation and neighbourhood change, AHURI, using 2016 ABS Census data, CC BY-NC
The locations of the four neighbourhood (SA2 areas) types and their SEIFA status (blue is top 10% of scores) across Sydney. Note: blank areas are non-residential areas of extremely low population.
Authors, Spatial segregation and neighbourhood change, AHURI, using 2016 ABS Census data, CC BY-NC
Melbourne emerges as a much more equitable city than Sydney. The segregation effects are not as strong in Melbourne. When it occurs, like Sydney, segregation occurs at the higher ends of the market, rather than at the lower ends.
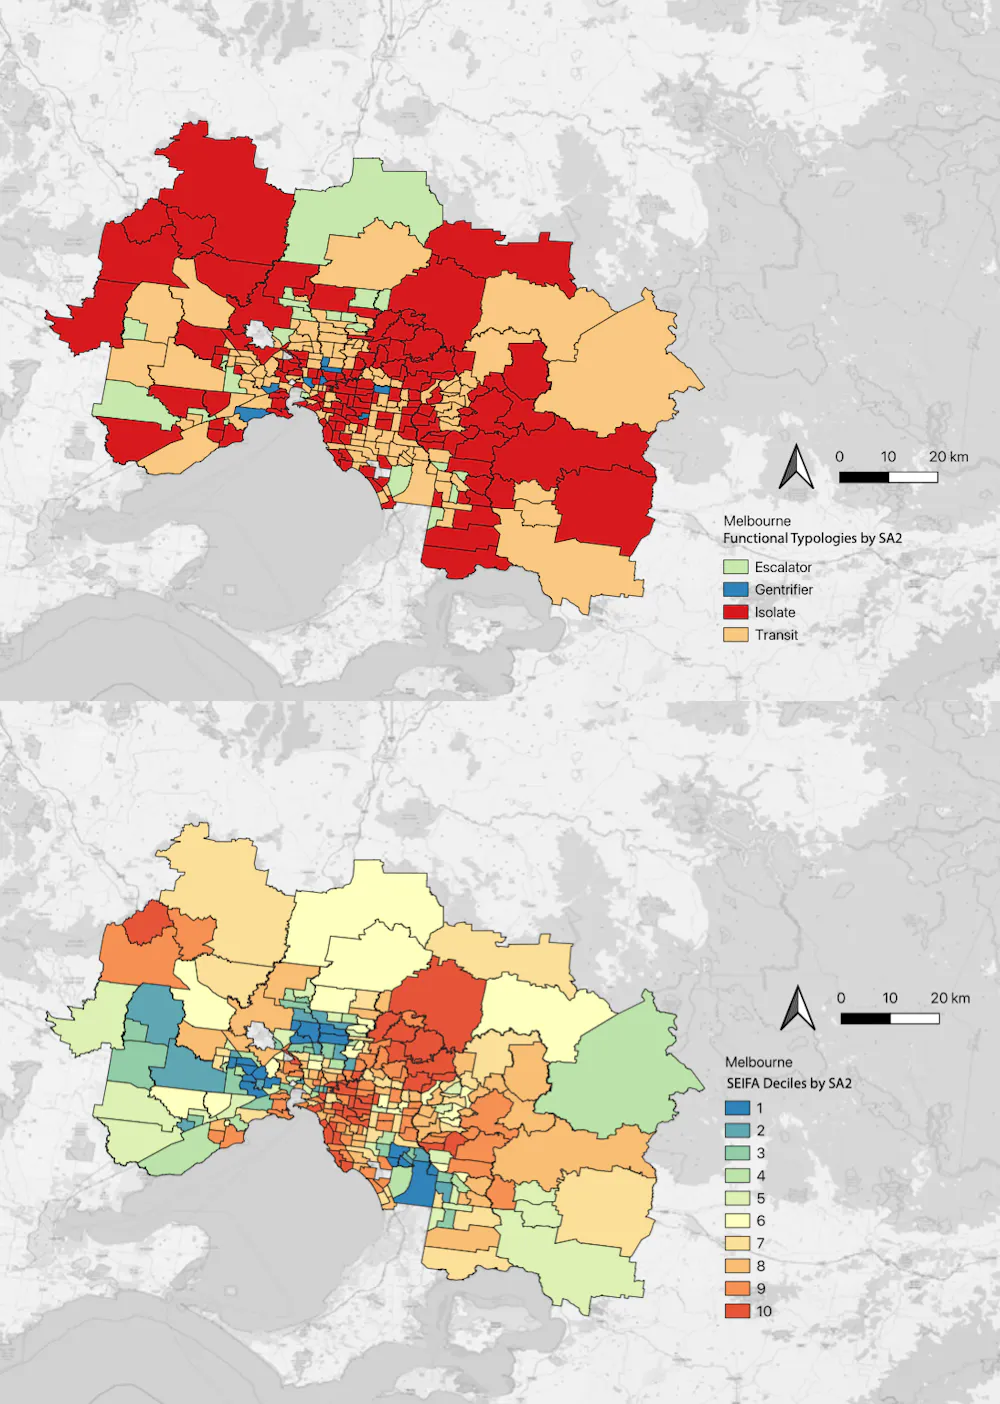 The locations of the four neighbourhood (SA2 areas) types and their SEIFA status (blue is top 10% of scores) across Melbourne.
Authors, Spatial segregation and neighbourhood change, AHURI, using 2016 ABS Census data, CC BY-NC
The locations of the four neighbourhood (SA2 areas) types and their SEIFA status (blue is top 10% of scores) across Melbourne.
Authors, Spatial segregation and neighbourhood change, AHURI, using 2016 ABS Census data, CC BY-NC
Perth echoes Sydney, but weakly. The spatial concentration of moderate-income, high-income and very-high-income households has increased in Perth.
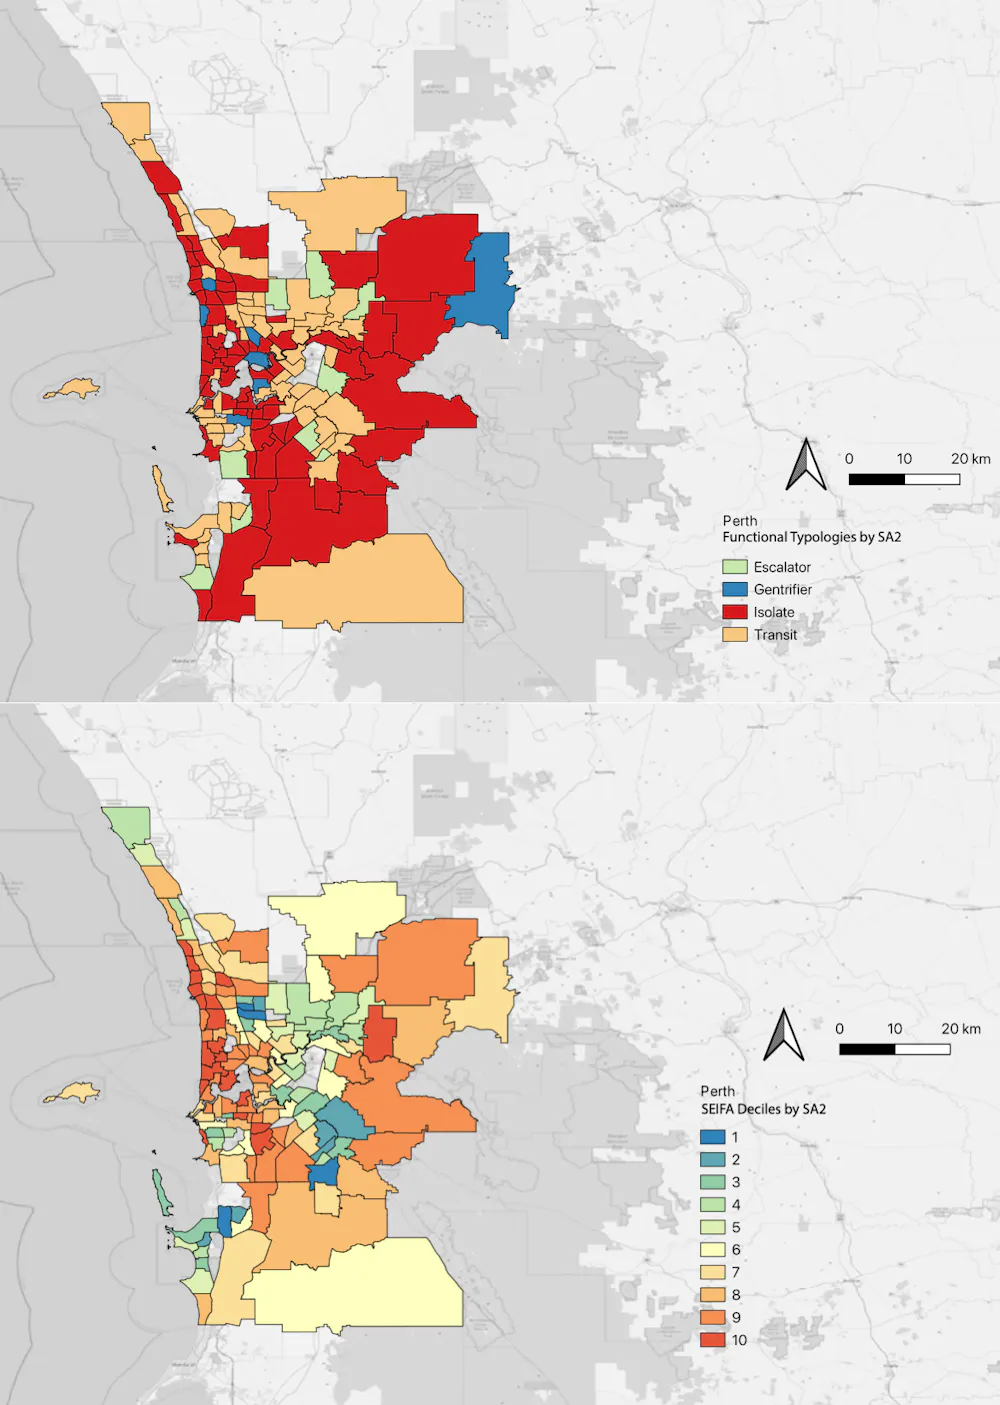 The locations of the four neighbourhood (SA2 areas) types and their SEIFA status (blue is top 10% of scores) across Perth.
Authors, Spatial segregation and neighbourhood change, AHURI, using 2016 ABS Census data, CC BY-NC
The locations of the four neighbourhood (SA2 areas) types and their SEIFA status (blue is top 10% of scores) across Perth.
Authors, Spatial segregation and neighbourhood change, AHURI, using 2016 ABS Census data, CC BY-NC
Brisbane and Adelaide are the most stable cities in this study. However, they still show the general trend towards segregation.
 The locations of the four neighbourhood (SA2 areas) types and their SEIFA status (blue is top 10% of scores) across Brisbane.
Authors, Spatial segregation and neighbourhood change, AHURI, using 2016 ABS Census data, CC BY-NC
The locations of the four neighbourhood (SA2 areas) types and their SEIFA status (blue is top 10% of scores) across Brisbane.
Authors, Spatial segregation and neighbourhood change, AHURI, using 2016 ABS Census data, CC BY-NC
 The locations of the four neighbourhood (SA2 areas) types and their SEIFA status (blue is top 10% of scores) across Adelaide.
Authors, Spatial segregation and neighbourhood change, AHURI, using 2016 ABS Census data, CC BY-NC
The locations of the four neighbourhood (SA2 areas) types and their SEIFA status (blue is top 10% of scores) across Adelaide.
Authors, Spatial segregation and neighbourhood change, AHURI, using 2016 ABS Census data, CC BY-NC
What can we do to create more cohesive cities?
Globally, segregated cities entrench disadvantage, drain productivity and deplete community wellbeing. Neighbourhoods, and mobility between neighbourhoods, matter..
Explicit targets to reduce spatial segregation should become front and centre of our spatial planning efforts. Wider government investment in social and economic infrastructure should underpin these targets.
A first step would be to make it mandatory for new developments across all suburban and regional localities to include affordable homes. Otherwise, the market will continue to sort lower-income earners into areas of lower opportunity.
Some parts of the United States, have so-called “anti-snob” laws to counter gentrification and exclusion processes. These laws allow affordable housing developers to override planning rules in areas that lack lower-cost options.
In Hong Kong, Singapore and the Netherlands, governments co-ordinate infrastructure and residential development with public transport services. They ensure or directly deliver a range of social and affordable homes for people of all incomes to rent or buy.
These examples show what can be done to fix our housing problem and reduce the segregation in our cities. Governments need to do more than call for new housing supply, or promise planning rule reforms to increase densities, or offer grants to first-home buyers. A target “number” of new dwellings isn’t enough.
We also need to have a planned and nuanced response to where these new homes would be located. These homes must be:
Setting measurable targets for affordable housing inclusion alongside investment in transport, education, health and cultural infrastructure would be a good start.
Authors: Somwrita Sarkar, Senior Lecturer in Design and Computation, University of Sydney


 Daily Bulletin


