Labor is right to talk about well-being, but it depends on where you live
- Written by Ida Kubiszewski, Associate professor, Crawford School of Public Policy, Australian National University
Labor’s treasury spokesman, Jim Chalmers, wants to follow New Zealand’s example and introduce a “wellbeing budget” alongside the traditional budget that stresses economic growth, when Labor is next in office.
New Zealand’s budget, introduced last year, targets mental health, child welfare, indigenous reconciliation, the environment, suicide, and homelessness, along side more traditional measures such as productivity and investment.
Iceland is drawing up its own plans and Scotland isn’t far behind.
The United Nations is also promoting the concept through Sustainable Development Goals, and the Organisation for Economic Co-operation and Development through a Better Life Index.
The international Wellbeing Economy Alliance has thousands of individual members, more than 100 institutional members, a handful of governmental members, and is quickly growing.
Why governments should prioritise well-being, Nicola Sturgeon, First Minister of Scotland, July 2019.
Life satisfaction can be measured
Life satisfaction isn’t to difficult to measure, and can be compared between countries, over time.
The Gallup Organisation regularly asks the same question in 150 countries covering 98% of the world’s population:
Imagine an 11-rung ladder where the bottom (0) represents the worst possible life for you and the top (10) represents the best possible life for you
On which step of the ladder do you feel you personally stand at the present time?
In a similar way, Australia’s Household, Income and Labour Dynamics Survey (HILDA) asks:
All things considered, how satisfied are you with your life?
Answer on a scale from 0 (totally dissatisfied) to 10 (totally satisfied)
But it varies from place to place
In Australia, the national average can be misleading. Our analysis of the HILDA data, published in the journal of Ecological Economics, finds significant differences between areas of Australia related to factors such as environment, employment, health, and social structures, amongst others.
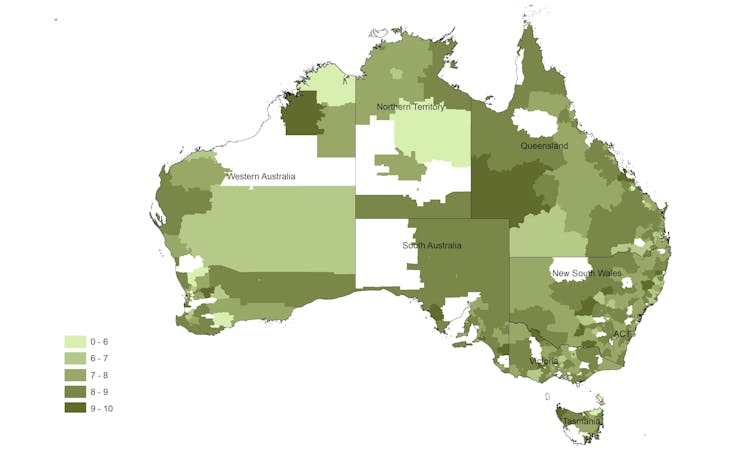
The map below shows that, while the national average was 7.5, in some areas of Australia the regional average was as low as 3. In other regions, it was as high as 10.
Average life satisfaction by region 2001-2017, scale 0 to 10
 HILDA, Kubiszewski, Jarvis and Zakariyya, 2019
But even these averages hide people with extraordinarily low levels of life satisfaction.
On average, 3% of the Australians surveyed between 2001 and 2017 reported a score between 0 and 4, a range so low as to be considered “suffering” by Gallup.
Over the same period, around 10% reported a score between 5 and 6 (“struggling”) and 87% reported a score between 7 and 10 (“thriving”).
Acknowledging this diversity is critical to ensuring happy lives for all Australians.
And what helps varies by location
What matters to life satisfaction appears to also vary from place to place.
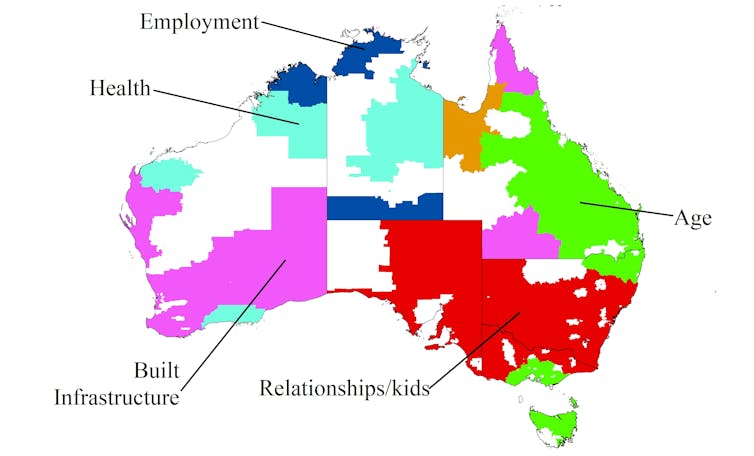
We found that what matters most in parts of South Australia, Victoria and New South Wales is the relationships people have with their children and partners. In a large part of Western Australia it is built infrastructure. In some other parts of Western Australia and the Northern Territory it is personal health.
What matters most for life satisfaction by location
 Average 2001-2007.
HILDA, Kubiszewski, Jarvis and Zakariyya, 2019
It’s the same with what harms life satisfaction.
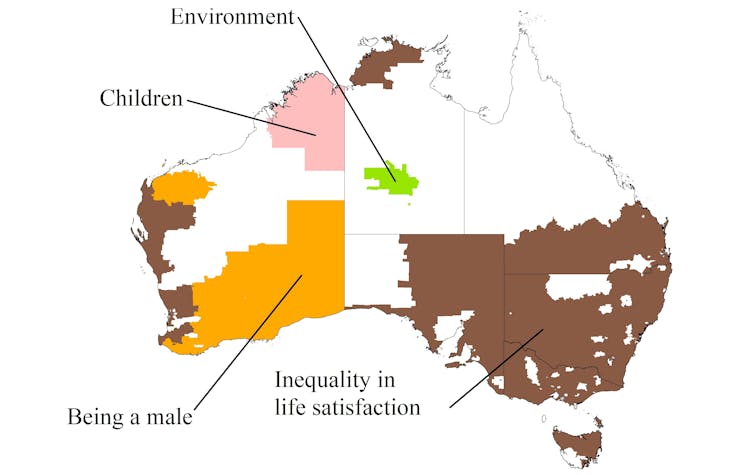
In South Australia, Victoria, New South Wales and even parts of Queensland, inequality in life satisfaction itself contributes most to decreasing of life satisfaction.
In the central Northern Territory it’s the harsh environment. In parts of Western Australia it’s simply being a male, or having children.
What most harms life satisfaction by location
 Average 2001-2007.
HILDA, Kubiszewskia, Jarvis and Zakariyya, 2019
None of this means that all of these factors aren’t important to all of us to some extent.
What it does mean is that there are difference in how each of us prioritises what is more important. Some of us choose careers while others choose large families, some choose nightclubs and five-star restaurants while others choose remote beaches.
Read more:
How do we measure well-being?
It means that while national programs can be useful, local and regional policies can be critical.
Formulating local policies is time-consuming and complex, and requires information, but it is worthwhile.
It might help to add another question or two to the census with answers recorded by location.
One might be: “All things considered, how satisfied are you with your life?”
Authors: Ida Kubiszewski, Associate professor, Crawford School of Public Policy, Australian National University


