

Smart city or not? Now you can see how yours compares
- Written by: Tan Yigitcanlar, Associate Professor of Urban Studies and Planning, Queensland University of Technology
The highest-ranked areas in an Australia-wide assessment of smart city performance are all in metropolitan regions with higher population densities. “Australia’s 60 top-performing local government areas house more than quarter of the nation’s population,” we note in the newly released Smart Cities Down Under report.
As well as highlighting major regional disparities, our analysis reveals the local government areas we assessed against four smart city indicator areas generally perform strongly in one of these, “Liveability and Well-being”. Performances are weaker in “Sustainability and Accessibility” and “Governance and Planning”. High performance in “Productivity and Innovation” existed only in the top-performing areas.
We assessed 180 local government areas (out of 563 in Australia), representing more than 85% of the nation’s population, against smart city criteria. We included all local government areas in metropolitan Australia (Greater Capital City Statistical Areas) and regional local government areas with populations of more than 50,000.
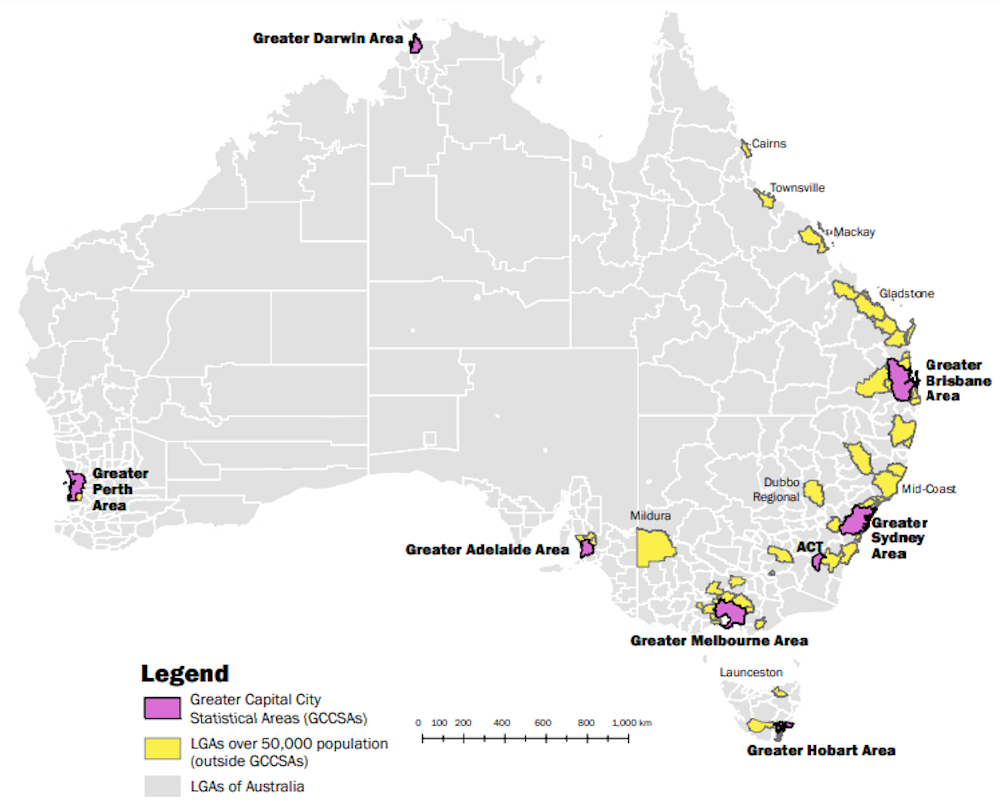 Locations of investigated local government areas.
Author provided
Locations of investigated local government areas.
Author provided
This study is an expanded version of the Smart Cities of the Sunshine State 2018 report.
Read more: Just how 'city smart' are local governments in Queensland?
It’s not all about technology
Cities are complex systems and should be evaluated in a holistic way. This means not placing excessive weight on technological achievements – such as tech for tech’s sake – in lieu of economic, social, environmental and governance outcomes.
Read more: Smart cities: world's best don't just adopt new technology, they make it work for people
Our conceptual framework to evaluate smartness levels was built on the four pillars of economy, society, environment and governance. The evaluation criteria are shown below.
 Author provided
We categorised the 180 local government areas we assessed into three performance categories:
leading, the best-performing cities
following, the cities with achievements and potential, but not at the level of the best performers
developing, the cities with some progress and potential, but not as substantial as the other two categories.
Who’s leading the way?
All areas in the leading category were completely contained within capital city metropolitan areas.
New South Wales ranked first with 20 local government areas. Then came Western Australia (14), Victoria (12), South Australia (9), Northern Territory (2) and Queensland, Australian Capital Territory and Tasmania (1 each). In terms of population in leading areas, the ranking changed to: NSW (2,348,388 people), Victoria (1,477,964), Queensland (1,131,155), WA (557,163), ACT (397,397), SA (370,719), NT (112,590) and Tasmania (50,439).
You can see below how the combined results for each of leading, following and developing performers compare against the four smart city indicator areas.
Author provided
We categorised the 180 local government areas we assessed into three performance categories:
leading, the best-performing cities
following, the cities with achievements and potential, but not at the level of the best performers
developing, the cities with some progress and potential, but not as substantial as the other two categories.
Who’s leading the way?
All areas in the leading category were completely contained within capital city metropolitan areas.
New South Wales ranked first with 20 local government areas. Then came Western Australia (14), Victoria (12), South Australia (9), Northern Territory (2) and Queensland, Australian Capital Territory and Tasmania (1 each). In terms of population in leading areas, the ranking changed to: NSW (2,348,388 people), Victoria (1,477,964), Queensland (1,131,155), WA (557,163), ACT (397,397), SA (370,719), NT (112,590) and Tasmania (50,439).
You can see below how the combined results for each of leading, following and developing performers compare against the four smart city indicator areas.
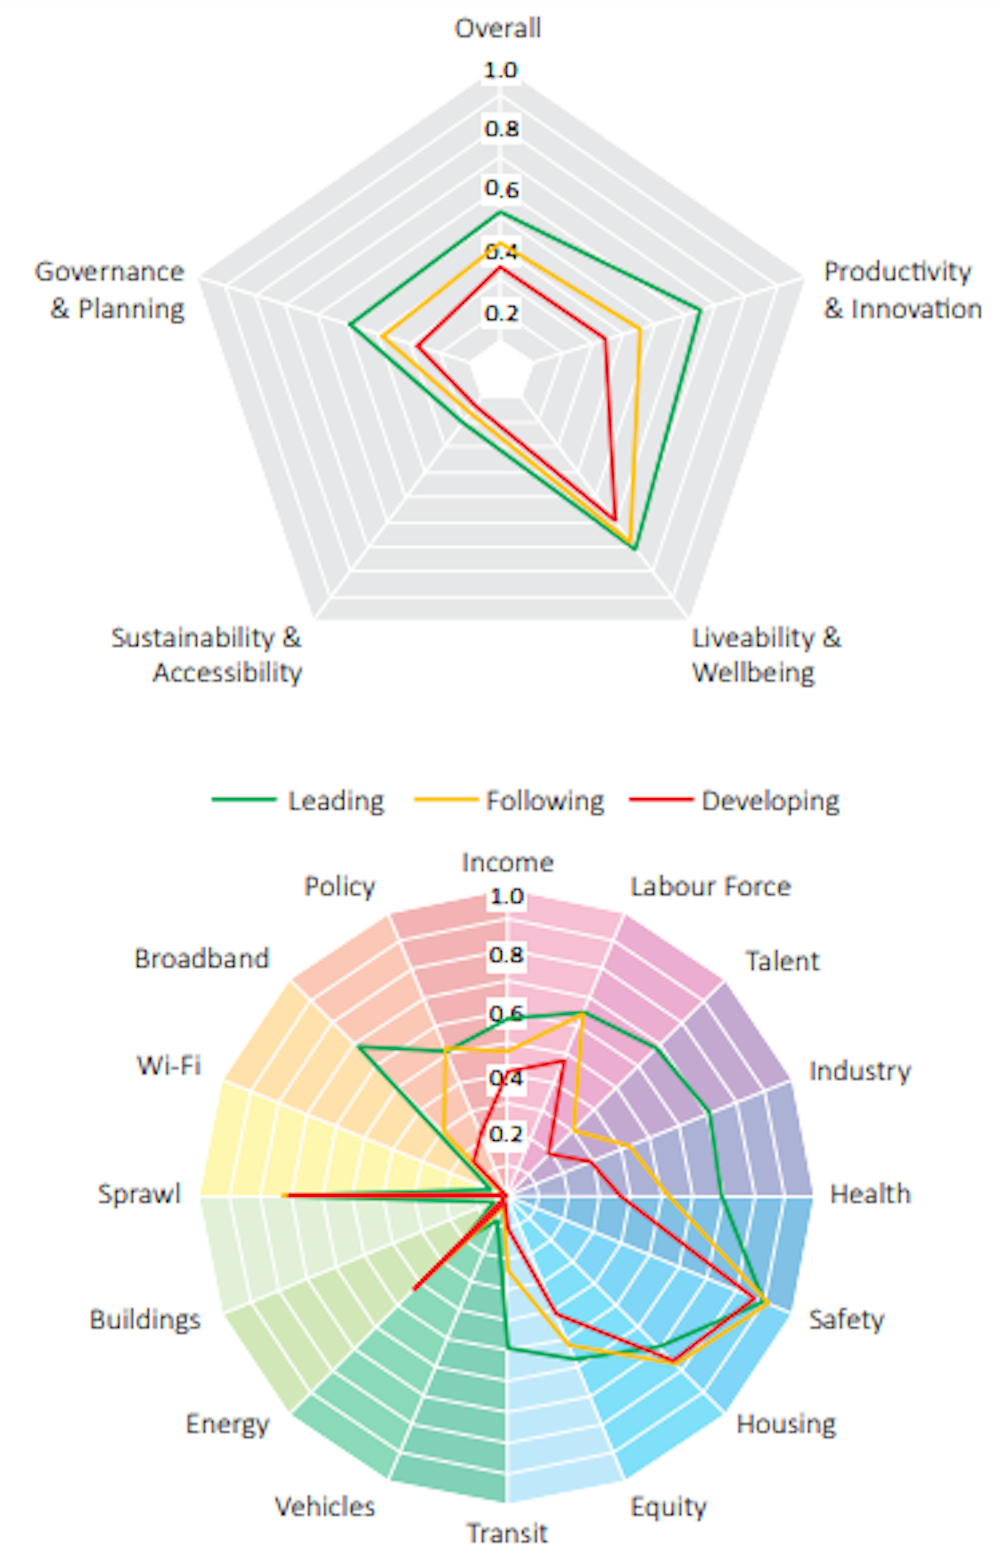 Comparison of leading, following and developing cluster performances.
Author provided
You can see the smart city performance matrix of your local government area here.
Read more:
From Smart Cities 1.0 to 2.0: it's not (only) about the tech
Key steps towards smarter cities
Metropolitan local government areas dominate the leading performance category. Mechanisms such as the Australian government’s City and Regional Deals and funding through the Smart Cities and Suburbs Program have delivered some tangible impacts.
The performance is less strong in regional Australia. A national smart city strategy and guidelines are needed to help make these localities and communities smarter.
This policy should take on the following findings of our international study of smart cities:
smart cities that focus only on technology seldom work
local governments should adopt the role of facilitator
risks need to be shared with the private sector
local governments should be open to innovations and learn from mistakes
smart cities should focus on being inclusive
resource consumption must be considered, particularly in relation to the longevity of technological infrastructure
long-term sustainability depends on renewable resources
smart cities require a smart community that is knowledgeable, conscious, forward-thinking, engaged, united and active.
Read more:
How does a city get to be 'smart'? This is how Tel Aviv did it
The Urban Studies Lab at Queensland University of Technology prepared the report in partnership with the Commonwealth Department of Infrastructure, Transport, Regional Development and Communication. Our Smart City Research Team has had conversations with city managers, mayors, local government professionals and key community stakeholders (e.g., businesses, not-for-profits, NGOs and academic institutions, among others). These conversations confirm local governments have a critical role to play if Australia is to manage vexing societal challenges from climate change to accessing economic opportunities, and even dealing with transformations driven by information technologies such as automation, innovation and artificial intelligence).
Read more:
As cities grow, the Internet of Things can help us get on top of the waste crisis
Local governments do not function well in isolation. Any local government is only as strong as the other local governments within its vicinity. They must interact to share and access public resources.
Leading cities can learn from the frugal innovations of their less fortunate peers. Our best-performing cities are similar to incumbents in the industry sector in that they face their own challenges to modernise.
Too often these cities seek solutions that are not frugal and cannot leverage indigenous knowledge. Less well-resourced communities must engage in different modes of innovation. We believe better networks need to be set up to foster dialogue and exchange practices across communities.
The good news in our report is that our leading cities fare well. The not-so-good news is that the other local governments need to be brought along on a transformation journey. No city is an island, and no country can treat cities as independent elements.
Australia, we believe, should consolidate its local governance and planning culture to lead the change.
Comparison of leading, following and developing cluster performances.
Author provided
You can see the smart city performance matrix of your local government area here.
Read more:
From Smart Cities 1.0 to 2.0: it's not (only) about the tech
Key steps towards smarter cities
Metropolitan local government areas dominate the leading performance category. Mechanisms such as the Australian government’s City and Regional Deals and funding through the Smart Cities and Suburbs Program have delivered some tangible impacts.
The performance is less strong in regional Australia. A national smart city strategy and guidelines are needed to help make these localities and communities smarter.
This policy should take on the following findings of our international study of smart cities:
smart cities that focus only on technology seldom work
local governments should adopt the role of facilitator
risks need to be shared with the private sector
local governments should be open to innovations and learn from mistakes
smart cities should focus on being inclusive
resource consumption must be considered, particularly in relation to the longevity of technological infrastructure
long-term sustainability depends on renewable resources
smart cities require a smart community that is knowledgeable, conscious, forward-thinking, engaged, united and active.
Read more:
How does a city get to be 'smart'? This is how Tel Aviv did it
The Urban Studies Lab at Queensland University of Technology prepared the report in partnership with the Commonwealth Department of Infrastructure, Transport, Regional Development and Communication. Our Smart City Research Team has had conversations with city managers, mayors, local government professionals and key community stakeholders (e.g., businesses, not-for-profits, NGOs and academic institutions, among others). These conversations confirm local governments have a critical role to play if Australia is to manage vexing societal challenges from climate change to accessing economic opportunities, and even dealing with transformations driven by information technologies such as automation, innovation and artificial intelligence).
Read more:
As cities grow, the Internet of Things can help us get on top of the waste crisis
Local governments do not function well in isolation. Any local government is only as strong as the other local governments within its vicinity. They must interact to share and access public resources.
Leading cities can learn from the frugal innovations of their less fortunate peers. Our best-performing cities are similar to incumbents in the industry sector in that they face their own challenges to modernise.
Too often these cities seek solutions that are not frugal and cannot leverage indigenous knowledge. Less well-resourced communities must engage in different modes of innovation. We believe better networks need to be set up to foster dialogue and exchange practices across communities.
The good news in our report is that our leading cities fare well. The not-so-good news is that the other local governments need to be brought along on a transformation journey. No city is an island, and no country can treat cities as independent elements.
Australia, we believe, should consolidate its local governance and planning culture to lead the change.
Authors: Tan Yigitcanlar, Associate Professor of Urban Studies and Planning, Queensland University of Technology
Read more https://theconversation.com/smart-city-or-not-now-you-can-see-how-yours-compares-130881


