Catholic schools aren't all the same, and Gonski 2.0 reflects this
- Written by Peter Goss, School Education Program Director, Grattan Institute
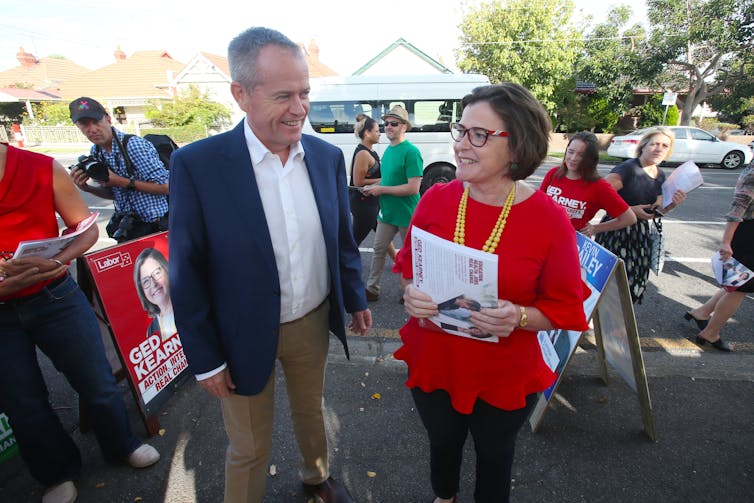
Bill Shorten is being accused of buying support from the Catholic sector to win the seat of Batman, by appearing to promise Catholic schools A$250 million in the first two years of a Labor government. The Catholic sector says this money goes a way to restoring the funding lost in the Gonski 2.0 reforms. Public and independent schools are outraged at the perceived favouritism.
Part of the key to making sense of this seemingly endless debate is to recognise that Catholic schools are not all the same. Even more important is that government funding, under the Gonski 2.0 model, will reflect the actual socioeconomic mix of each school.
 Bill Shorten has been accused of buying support from the Catholic schools sector to win the seat of Batman.
David Crosling/AAP
Batman, for instance, is a diverse electorate, which provides an interesting case study. The Catholic schools serving the highest proportion of educationally disadvantaged students will either be unaffected by Gonski 2.0, or will attract more government funding. Those with more students in higher socioeconomic groups will be affected – but this is fair policy.
How schools funding works
Under the new schools funding model, often called Gonski 2.0, a school resourcing standard (SRS) is calculated for each school. This target level of funding incorporates three elements.
The first is a level of base funding per student for all schools. In 2018, this is A$13,764 per secondary school student and A$10,953 per primary student.
The second is additional needs-based funding based mainly on the characteristics of each school’s students. This is measured in terms of low socio-economic status (SES), disability, and language background other than English.
The third element is an estimate of the capacity of parents who send their children to non-government schools to contribute towards the cost of schooling. This ranges from 10% of the base funding for low-SES schools to 80% for high-SES schools. This means Catholic and independent schools with poorer parents get more government funding than those with more affluent parents, even before individual student need is taken into account.
The estimated parental capacity to contribute is based on each non-government school’s SES score. This is calculated by looking at the average socioeconomic makeup of the areas where a school’s parents live.
 Catholic schools with an SES score of less than 100 will either be unaffected, or have their funding increased, under Gonski 2.0.
Shutterstock
A non-government school with students from a mix of average neighbourhoods would have an SES score of 100. In 2018, under Gonski 2.0, parents of a primary student in such a school would be expected to contribute about A$1,750 (16% of the base funding). This would be roughly twice as much for secondary school (A$3,484 or 25%).
A non-government school with students from very affluent neighbourhoods might have an SES score of 120-130. The expected parental contribution would range from A$6,700-A$8,760 for primary schools, and A$9,500-A$11,000 for secondary schools.
A non-government school whose families come from battling neighbourhoods might have an SES score of about 80. For such a school, parents would be expected to contribute the minimum 10% of base funding, or A$1,095 for primary students and A$1,376 for secondary students.
Read more: Confused about changes to school funding? Here's what you need to know
These are huge differences. Changing the SES score of a non-government secondary school by just one point means about A$300 more or less government funding per student. For non-government primary schools, this is worth between A$200 and A$400 per student.
This naturally influences school fees. When government funding is low, fees will typically be high. When government funding is high, schools can afford to set low fees.
From Gonski 1.0 to Gonski 2.0
The original Gonski model (in 2013) treated Catholic schools as a homogeneous group. They were allocated a “system-weighted average” score based on the state the school was in, such as a score of 101 in NSW.
Primary schools that came under this score had an expected parental contribution of 13.5%. Regardless of how advantaged a Catholic primary school might be, the formula never expected parents to contribute more than A$1,400.
 The original Gonski model from 2013 treated Catholic schools as a homogenous group.
Alan Porritt/AAP
This enabled all Catholic primary schools to keep their fees low – often in the range of A$2,000-A$3,500 even for the most highly advantaged schools and regardless of parents’ actual ability to pay.
Meanwhile, a highly advantaged independent primary school would need to have fees of at least A$8,000 per year to have adequate resources to educate its students.
Gonski 2.0 removed the system-weighted average. Funding for Catholic schools will still be handed over to each state as a lump sum, and each Catholic diocese will retain the right to allocate funding across its schools. But the calculation of the school resourcing standard for each school will take into account the huge differences in parents’ financial means.
Read more: Explainer: how does funding work in the Catholic school system?
The Batman case study
So back to Batman - where this latest funding fight has erupted. The northern part of the electorate is mainly covered by the generally working-class suburb of Reservoir. The middle is split between Preston and Thornbury, both of which have gentrified over recent years.
The southern end includes Northcote, Alphington, Fairfield and Clifton Hill, once home to Italian nonnas but now dominated by professionals keen to live close Melbourne’s centre. There are 13 Catholic primary schools in Batman. The SES scores range from 92 in Reservoir to 117 in Alphington.
Six socially diverse schools in the northern end of Batman have an SES score of less than 100. So their funding is unaffected, or even increased, under Gonski 2.0. Two other schools in the north have an SES score of just over 100. Most of their students (78%) come from families that are more advantaged than average, based on their parents’ education and occupation, and only 4% come from the most disadvantaged quarter of families. Their expected capacity to contribute will increase by less than A$1,000.
Read more: The passage of Gonski 2.0 is a victory for children over politics
Three schools in the middle of the electorate have an SES score of 108 or 109. These will be affected more: their expected capacity to contribute will increase by about A$2,000.
Two small schools at the southern end have an SES score of 115 or above. Their expected capacity to contribute will increase by about A$4,000 per student. But this would have a very different impact across the two schools, because one appears to serve advantaged families (70% of students from the most educationally-advantaged quartile and only 1% from the least), while the other is much more socially diverse (10% from the least advantaged quartile and another 20% from the second-lowest).
This highlights some of the limitations of the current SES score, which is one reason why it is so important to improve it in the current review by the recently appointed National School Resourcing Board.
A national picture
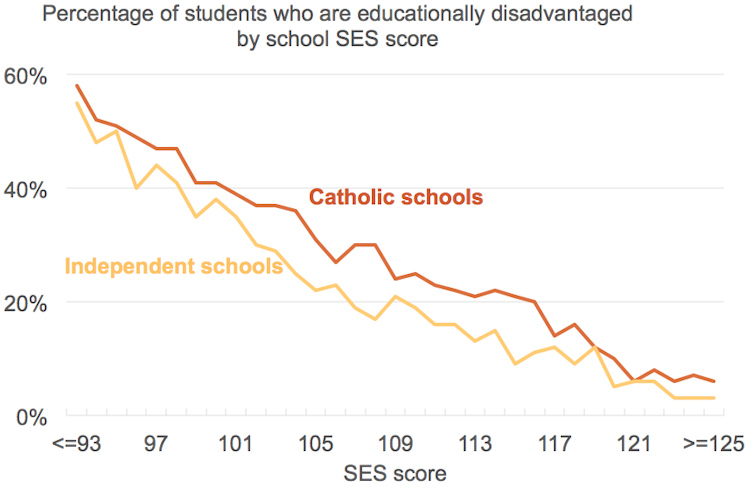
The nationwide picture is similar to that of Batman. For Catholic schools with the lowest SES scores, nearly three-quarters of their students come from families that are less advantaged than average. For Catholic schools with the highest SES scores, this proportion is well under 10%.
 Educationally disadvantaged students are the bottom two quartiles of the socio-educational advantage (SEA) metric, a student-level measure of parental education and occupation that is reported on MySchool.
Grattan Institute, CC BY-NC-SA
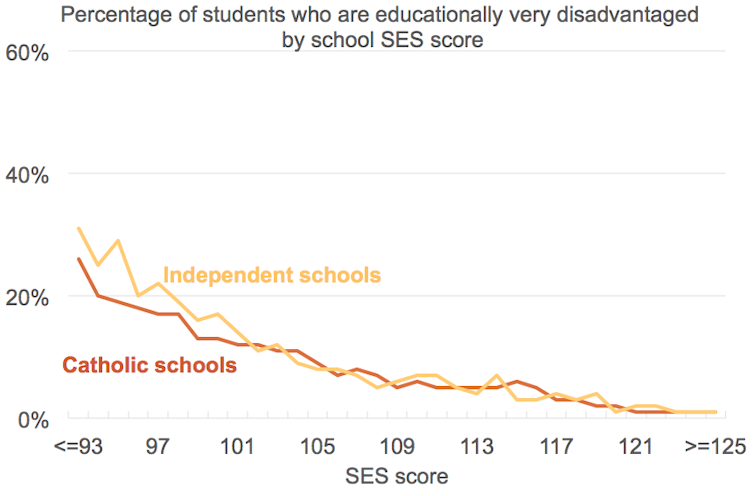
Looking at the most educationally disadvantaged quartile of students, Catholic schools look even more similar to independent schools with the same SES score.
 Educationally very disadvantaged students are the bottom quartile of the socio-educational advantage (SEA) metric, a student-level measure of parental education and occupation that is reported on MySchool.
Grattan Institute, CC BY-NC-SA
In fact, for the 21 Catholic primary schools with an SES score of 125 (where the capacity to contribute curve tops out), only about 20 students out of 5,500 come from the bottom quartile. It is hard to argue these schools are socially diverse, or serving the poorer students, arguments sometimes made to justify the need to keep their fees low.
So, not all Catholic schools are the same, and we should stop talking about them as if they were.
Authors: Peter Goss, School Education Program Director, Grattan Institute
Read more http://theconversation.com/catholic-schools-arent-all-the-same-and-gonski-2-0-reflects-this-93722


