Homelessness soars in our biggest cities, driven by rising inequality since 2001
- Written by Sharon Parkinson, Senior Research Fellow, Centre for Urban Transitions, Swinburne University of Technology
Homelessness has increased greatly in Australian capital cities since 2001. Almost two-thirds of people experiencing homelessness are in these cities, with much of the growth associated with severely crowded dwellings and rough sleeping.
Homelessness in major cities, especially severe crowding, has risen disproportionately in areas with a shortage of affordable private rental housing and higher median rents. Severe crowding is also strongly associated with weak labour markets and poorer areas with a high proportion of males.
These are some of the key findings of our Australian Housing and Urban Research Institute (AHURI) research released today.
Read more: Why Australia's homelessness problem is getting worse, despite a rise in housing stock
Extending previous AHURI work, we combine 15 years (2001-2016) of homeless estimates from the Australian Census, other customised census and the Australian Institute of Health and Welfare’s Specialist Homelessness Service Collection (SHSC) data.
People counted as homeless on census night live in: improvised dwellings, tents or sleeping out (rough sleeping); supported accommodation; staying temporarily with other households (i.e. couch surfing); boarding houses; temporary lodging; or severely crowded conditions.
How has the geography of homelessness changed?
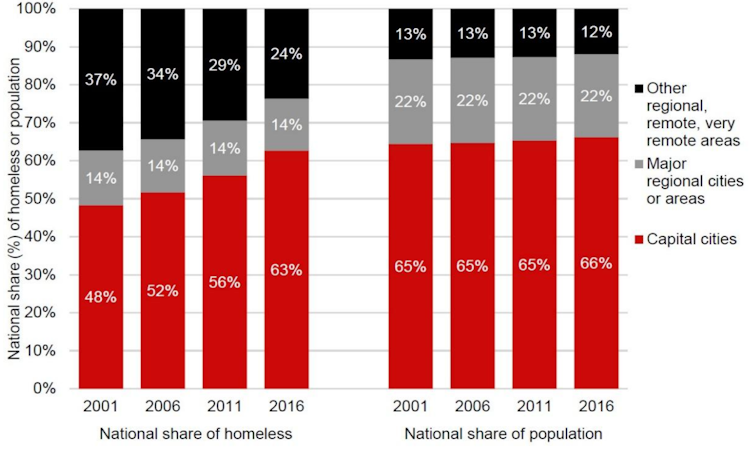
Nationally, 63% of all homelessness is found in capital cities. That’s up from 48% in 2001.
Shares (%) of homelessness and population by area type
 Authors’ panel dataset (ABS Census homelessness estimates)
At the same time, homelessness has been falling in remote and very remote areas. However, it still remains higher in these areas per head of population.
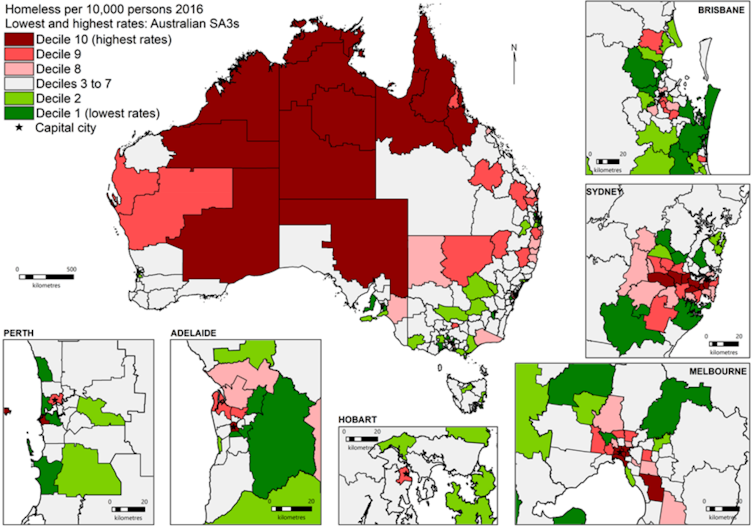
Homelessness is also becoming more dispersed across major cities.
In Sydney, a corridor of high homelessness rates stretches from the inner city westward through suburbs such as Marrickville, Canterbury, Strathfield, Auburn and Fairfield (more than 30km from the CBD).
In Melbourne, high homelessness rates are found in Dandenong (around 25km southeast of the CBD), Maribyrnong and Brimbank to the west, Moreland and Darebin to the north and Whitehorse to the east, about 15km from the CBD.
Homeless rates in Australia 2016
 Authors’ panel dataset (ABS Census homelessness estimates and TSP); ABS digital Statistical Geography Boundaries, SA3, 2016
After accounting for population growth, we see a decline in homeless rates in the CBD and inner areas of Perth, Adelaide, Melbourne and to an extent Brisbane over the 15 years. At the same time, homeless rates in outer urban areas have increased. In many regions this increase outpaced population growth.
Change in homeless rate compared with population growth 2001–2016
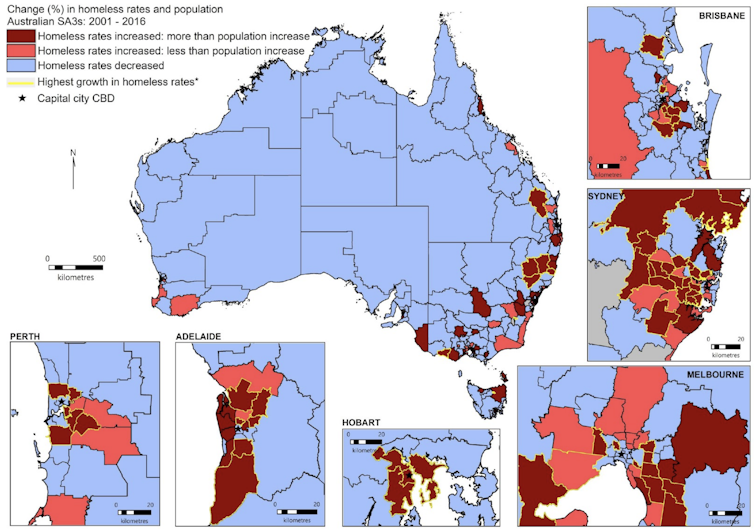 The highest growth in homeless rates is in those areas where rates increased by 40% or more (the top two deciles) from 2001–2016.
Authors’ panel dataset (ABS Census homelessness estimates and TSP); ABS digital Statistical Geography Boundaries, SA3, 2016
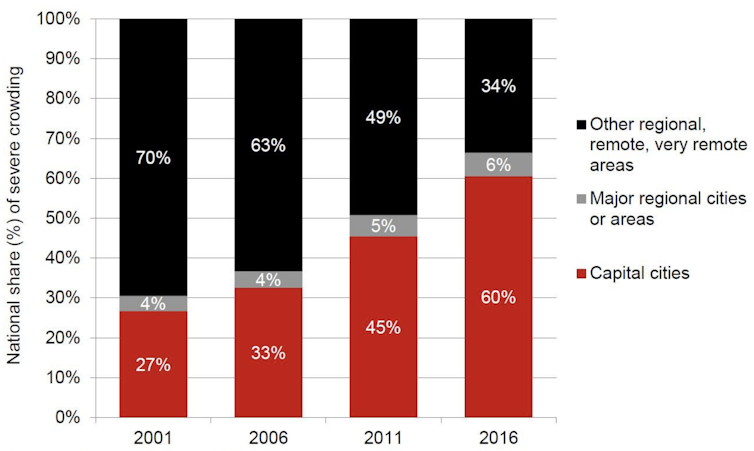
The numbers of households living in severely crowded dwellings in capital cities have doubled in 15 years, accounting for much of the growth in homelessness overall. In 2001, this group accounted for 35% of people experiencing homelessness, with 27% living in cities. By 2016, severe crowding rates had soared to 44% of all people experiencing homelessness, with 60% living in capital cities.
Share of severe crowding by area type, 2001–2016
 Authors’ panel dataset (ABS Census homelessness estimates)
Read more:
Tracking the rise of room sharing and overcrowding, and what it means for housing in Australia
Rough sleeping has also transformed into an urban phenomenon — nearly half of all rough sleepers in Australia are now found in capital cities.
What is driving these changes?
Homelessness has risen disproportionately in areas with a shortage of affordable private rental housing and higher median rents. That’s especially the case in Sydney, Hobart and Melbourne. In capital city areas with a shortage of affordable private rentals in both 2001 and 2016, severe crowding grew rapidly (by 290.5%) against all homelessness growth (32.6%).
Changes in share of homeless and population by city and region, 2001-16
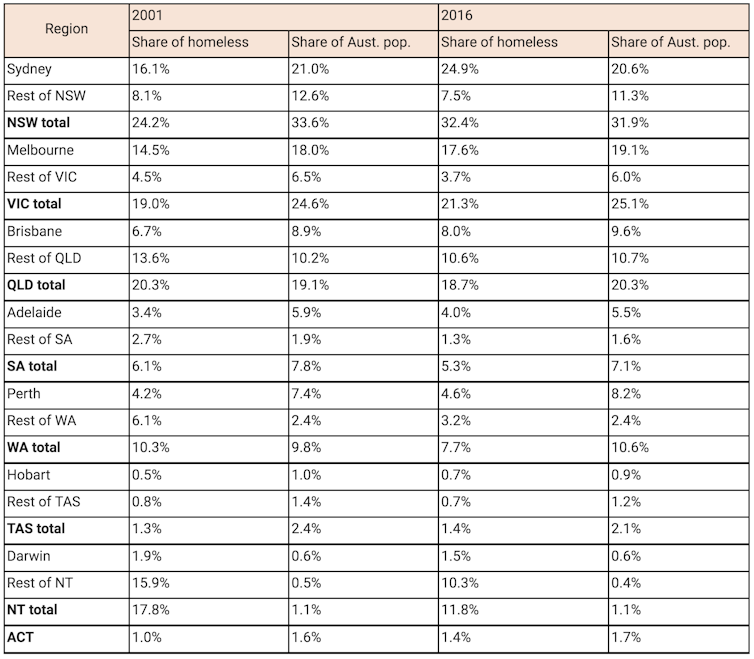 Authors' panel dataset (ABS Census homelessness estimates and TSP), Author provided
The effects of rental affordability on homelessness rates still hold after controlling for other area characteristics. We also find that these rates are strongly correlated with higher shares of particular demographic groups in an area, including males, younger age groups, young families, those with an Indigenous or ethnic background, and unmarried persons.
Read more:
Youth homelessness efforts get a lowly 2 stars from national report card
Severe crowding in capital cities is also strongly associated with weak labour markets and poorer areas with a high proportion of males. However, these associations do not hold for severe crowding in remote areas.
What should governments and services do?
The way our cities are becoming more unequal over time is shaping the changes in the geography of homelessness.
Governments must find ways to urgently increase both the supply and size of affordable rental dwellings for people with the lowest incomes. We also require better integration of planning, labour, income support and housing policies targeted to areas of high need.
Rates of severe crowding remain highest in remote areas, and continued efforts to increase housing supply in remote areas, such as the National Partnership on Remote Housing (NPRH), are needed. Targeted responses are required to combat its growth in major cities.
Read more:
Building in ways that meet the needs of Australia’s remote regions
It is critical that specialist homelessness services, as a first response to homelessness, are well located to respond in areas where demand is highest.
The AHURI report can be downloaded here.
Authors: Sharon Parkinson, Senior Research Fellow, Centre for Urban Transitions, Swinburne University of Technology


