

Census 2016: what's changed for Indigenous Australians?
- Written by: Nicholas Biddle, Associate Professor, ANU College of Arts and Social Sciences, Australian National University
Aboriginal and Torres Strait Islander people have a complicated history with the Australian census. Until the 1967 referendum, the question about Indigenous status was used mainly to exclude the Indigenous population from official population statistics, as required by the Constitution at that time.
Since the 1971 Census, however, the question has been used to understand Indigenous demographic and socioeconomic outcomes. This includes observing how Indigenous peoples’ situations are changing through time, and comparing them to the non-Indigenous population.
Indigenous population estimates matter for policymaking. For example, the Commonwealth Grants Commission uses estimates of the Indigenous population to advise on GST revenue allocation to the states and territories. And many Closing the Gap targets are monitored in full or in part using census data.
At the same time, many Indigenous communities and organisations argue that the way data are collected and distributed takes power out of their hands, and puts them at a disadvantage.
So, what did we learn from the most recent release of 2016 Census data?
A rapidly growing population
First, the Indigenous population is growing – rapidly. In data released on Tuesday, it was estimated there are 786,689 Australians who identify as Aboriginal or Torres Strait Islander. This is a 17.4% increase from 2011.
This estimate of the total Indigenous population is based on the 2016 Census, but also takes into account people who were missed in the count. Indigenous Australians are now estimated to represent 3.3% of the total Australian population, up from 3% in 2011.
Setting aside for the moment those who were missed, 649,171 people identified themselves as being “of Aboriginal or Torres Strait Islander origin” in the 2016 Census. This is up 18.4% from 2011.
There are several reasons for the rapidly growing visibility of Indigenous Australians in our population statistics.
The first is the natural increase of the Indigenous population. On average, Indigenous Australians have a slightly higher number of children than non-Indigenous Australians.
In addition, the children resulting from relationships between Indigenous and non-Indigenous Australians often identify as Indigenous, accelerating the growth of the Indigenous population. However, even after taking these factors into account, the Indigenous population was projected to reach no more than 746,815 by 2016 – around 40,000 people fewer than the latest census-based estimate.
While we won’t know how accurate the assumptions underlying these projections were for some time, the probable explanation for the “extra” 40,000 Indigenous people is that some individuals who chose not to identify as Indigenous in 2011 decided to identify as Indigenous in 2016.
The change in propensity to identify as Indigenous makes comparisons over time difficult. Any change in socioeconomic outcomes is likely to partly result from changing life-chances for Indigenous Australians, but is also likely to be partly attributable to the change in the group of people who are classified part of the Indigenous population.
However, because the group of newly identifying Indigenous people is around 5% of the Indigenous population, any change in socioeconomic indicator that is greater than 5% can at least be partly attributed to a change in the circumstances of the families who identified as Indigenous in 2011.
Population geography
Regardless of what factors drove Indigenous population growth in the 2016 Census, it is clear that population growth was not evenly distributed.
As the map below of the change in census counts between 2011 and 2016 shows, the Indigenous population increased by the greatest amount in Brisbane, on the New South Wales central and north coast, and Sydney – Wollongong. Almost half (49%) of the growth of the Indigenous population occurred in just these three regions.
Conversely, the Indigenous population of the East Kimberley, Alice Springs, and several other remote regions appeared to decline slightly.
These initial figures should be interpreted cautiously. The proportion of records for whom we do not have an answer to the Indigenous status question on the census increased by about one-third between censuses. Nevertheless, it is clear that Indigenous population growth remains concentrated in NSW and Queensland.
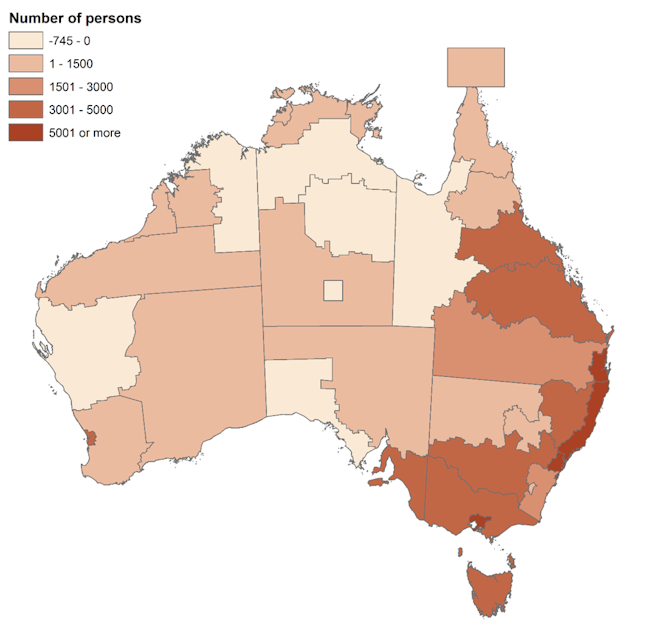 Indigenous population change by region.
Census 2016
Indigenous population change by region.
Census 2016
The changing distribution of the Indigenous population can be better understood through a cartogram, as in the figure below. Each circle represents a location defined by the Australian Bureau of Statistics as an “Indigenous Area”. The circles representing these locations have been sized so that their areas are proportionate to their Indigenous population count in 2011.
They have been moved on the map so they do not overlap, but under the constraint that they move as little as possible, that they remain within their state boundaries (except for the ACT), and that they retain their relative position next to each other as much as possible.
We have also added a line around the greater capital city areas to help readers identify them. Each area has been coloured in a manner that indicates the change in population between 2011 and 2016.
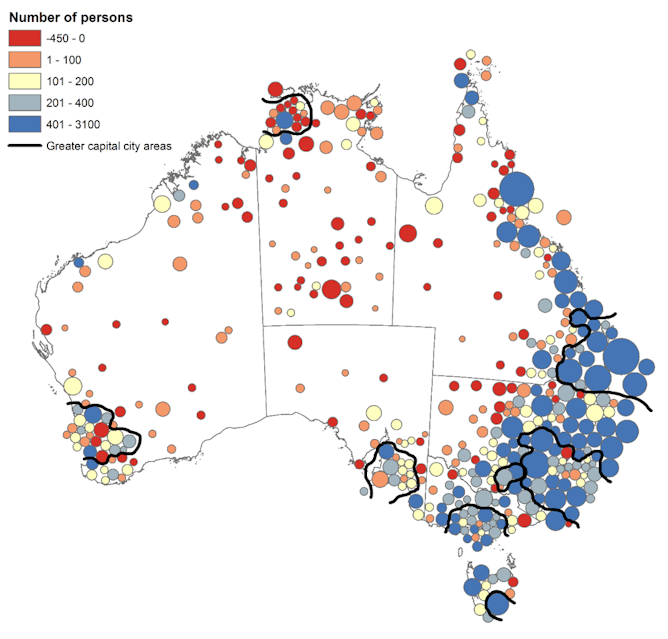 Indigenous population change by area.
Census 2016/Authors
Indigenous population change by area.
Census 2016/Authors
What the cartogram shows very clearly is that in 2011, the Indigenous population was already highly concentrated in coastal NSW and Queensland. The cartogram suggests the Indigenous population has grown substantially everywhere in the greater Brisbane/Gold Coast region, in much of the NSW central and north coast, and around the fringes of Greater Sydney and Greater Melbourne.
The places where the Indigenous population declined tend to be locations that had a low population in 2011 and that are located in remote parts of Australia. However, there are plenty of exceptions to both of these general patterns.
Language
In 2016, the number of people speaking an Australian Indigenous language at home increased by a small amount – to 63,754 persons from 60,550 in 2011.
This was an absolute increase. But it represents a decline in the proportion speaking an Australian Indigenous language – from 11.8% in 2011 to 10.5% in 2016.
This proportionate decline may result from Indigenous population growth being concentrated in areas where Indigenous languages are less commonly spoken. So, it would be hasty to jump to the conclusion that these results suggest language loss.
Education
Indigenous people are getting into the education system earlier and staying for longer. This is likely to lead to improved socioeconomic outcomes in future.
Early childhood education rates have increased. The percentage of three-to-five-year-olds who aren’t already at primary school that were attending preschool is up from 43.5% in 2011 to 48.5% in 2016.
At the secondary school level, 59.7% of Indigenous people aged 15-18 were attending school. This is up substantially from 51.2% in 2011.
Increased school attendance has flowed through to growth in the percentage of Indigenous people aged 15 or more who have completed year 12. This rose to 34.6% in 2016 from 28% in 2011.
Finally, the proportion of Indigenous 15-24-year-olds undertaking tertiary education appears also to have grown. In 2016, 16.2% of this cohort who were not at secondary school were studying for a tertiary qualification. This is up from 14.1% in 2011.
Significantly, this growth has been driven by increased university attendance (8.5% in 2016, up from 5.8% in 2011). Attendance at technical or further educational institutions has actually been falling (7.7% in 2016, down from 8.4% in 2011). This shift from technical education to university education is suggestive of the continued growth of an Indigenous middle class.
Income
Indigenous people are also earning more on average in 2016 than 2011.
Real median weekly personal pre-tax income is up from A$397 in 2011 to A$441 in 2016. Although incomes grew generally between censuses, the growth in incomes for Indigenous people outpaced that of the rest of the population. Nevertheless, on average, Indigenous people still receive a personal income that is only two-thirds that of the non-Indigenous population.
Similar trends were evident for household income: Indigenous household incomes are increasing more rapidly than non-Indigenous household incomes.
Housing
Similarly, home ownership rates among households with at least one Indigenous resident have increased slightly, from 37.4% to 39.6%.
Households with a resident who identifies as Indigenous are also slightly less likely to be overcrowded than in the past. The proportion of households in a house that doesn’t meet the international standard for overcrowding from 11.8% to 10.4%.
At the same time, overcrowding by the same measure among non-Indigenous households has risen between 2011 and 2016, from 3.2% to 3.6%.
Tempered optimism
The 2016 Census has mostly delivered a good news story in terms of Indigenous outcomes. But the extent to which these positive results indicate that life is getting better for Indigenous families remains unclear.
At least some of these apparent improvements are likely to be the result of people of relatively high socioeconomic status identifying as Indigenous for the first time.
In addition, there were a number of census records for which we know nothing about whether the person is Indigenous – around 6% of the total count. This is because these people didn’t fill out any census form, or they didn’t answer the Indigenous status question. Either way, we need to keep this uncertainty in mind when interpreting findings.
And while we have generally presented national figures here, socioeconomic outcomes for Indigenous people vary dramatically across Australia. Overall improvements, while welcome, may well mask less positive outcomes in specific regions.
Authors: Nicholas Biddle, Associate Professor, ANU College of Arts and Social Sciences, Australian National University
Read more http://theconversation.com/census-2016-whats-changed-for-indigenous-australians-79836


