Have the NRL's rule changes made boring blowouts the norm? The stats say no
- Written by Stephen Woodcock, Associate Professor of Mathematical Sciences, University of Technology Sydney

Throughout the 2021 National Rugby League (NRL) season, commentators bemoaned the number of “blowout” results with a wide margin of victory between the sides.
The average margin of victory during the season was 17.89 points, higher than for any season during the preceding decade.
Many critics, including NRL legend Johnathan Thurston, blamed recent rule changes, which aimed to speed up the game and reduce defending teams’ ability to regroup and catch a breather by giving away a penalty. The new rule, they argued, allows stronger teams to drive weaker opposition to exhaustion more easily.
But as every amateur statistician on Reddit can tell you, correlation does not imply causation. And if we take a closer look at the data, it seems the NRL isn’t quite as dull and predictable as feared.
No blowouts in Blighty
The rule change was also adopted by the world’s only other top-level rugby league competition, the English-based Super League. And, in contrast to the NRL, it didn’t see an uptick in one-sided games.
In fact, games in the 2021 Super League were closer overall (a 16.26-point average winning margin) than the year before (17.65). These figures are both lower than the 2021 NRL average, despite the widespread acceptance there is a bigger financial disparity between strong and weak teams in the Super League than there is in Australia.
For comparison, since the first Super League grand final in 1998, just four teams have won the competition and a further five have been defeated in the grand final. Over the same period, every NRL team (except the Gold Coast Titans, which only joined in 2007) has reached a grand final, and 12 clubs have been premiers.
Read more: The NRL’s unrivalled equality means back-to-back premierships are very rare
Similarly, looking at the two main state competitions in Australia, neither the Queensland Cup nor the New South Wales Cup saw such margins of victory occurring as in the NRL. So this suggests the rule changes alone are not to blame.
How do other sports stack up?
It’s not easy to compare winning margins across sports, because of the many different scoring systems. However, we can look at other measures of predictability.
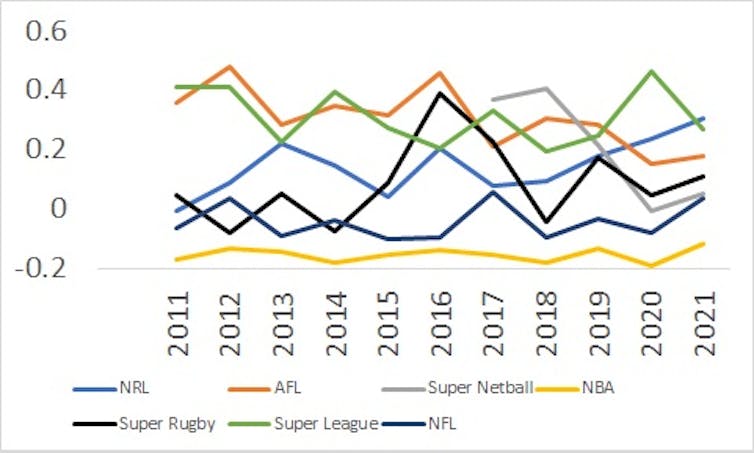
One method is to compare the score margins for the two halves of the game. A correlation of 1 between these would mean the team leading at half-time will definitely replicate this performance in the second half, thus showing the game is highly predictable. Conversely, a correlation of 0 would mean we can’t predict anything about the second half based solely on the score at half-time, suggesting the final result is excitingly difficult to call.
Based on this reasoning, how did the 2021 NRL season stack up? Well, although it was the most predictable in a decade (with a correlation of 0.303), this figure is far from remarkable when compared with other sporting codes.
In fact, it is almost identical to the ten-year (2012-21) average in the Australian Football League (AFL), and far below the high correlations seen in the mens’ AFL seasons of 2012 (0.478) and 2016 (0.457). It’s also well below that seen in Super Netball in both 2017 and 2018.
Interestingly, all the major Australian leagues are much more predictable than their North American counterparts. Looking at comparable data from the National Football League (NFL) and National Basketball Association (NBA), we routinely see correlations between the two halves’ margins much closer to 0, or even in negative territory, which means the team trailing at half-time is more likely to stage a comeback than slip further behind. The NBA, for example, typically sees correlations around -0.1.
Punting predictability
Across all sports, few factors predict outcomes as accurately as the pregame bookmakers’ odds. For each game the bookies issue a percentage probability of each team winning; obviously the “bookies’ favourite” team in each game has a higher percentage, depending on how close the game is predicted to be.
We can therefore measure the predictability of a league season by taking the average of the percentages assigned to every favourite team in every game.
In the NRL, this figure was 72% in 2020 and 76% in 2021 – the first time in more than a decade it has climbed above 70%. While this drop in competitiveness looks concerning, it should be viewed in the context of recent history. By comparison, the COVID-disrupted 2020 season was the only AFL season in that period not to average above 70%.
While there are periodic rumblings about AFL blowouts, it is generally seen as an open and entertaining competition each year.
All to play for in 2022
Although 2021 NRL scorelines were slightly more lopsided than during the previous decade, there is no real evidence to suggest recent rule tweaks were primarily to blame.
What’s more, looking across various measures of predictability, last year’s results were far from anomalous or concerning.
Read more: AFL and NRL grand final TV ratings show codes still rely on their traditional heartlands
In any sporting league, tactics are inherently cyclical. Innovative coaches find ways to gain an edge, perhaps by exploiting a rule change, before others find ways to counter this innovation.
Indeed, the intensively analysed rule changes of the past couple of years have been slightly tweaked yet again for the 2022 season, to discourage cynical infringements that were seen to benefit the offending team.
So there’s every reason to expect the 2022 NRL season, which kicked off with reigning champions Penrith thrashing Manly 28-6, will be as unpredictable and competitive as any major competition in the Australian sporting landscape.
Authors: Stephen Woodcock, Associate Professor of Mathematical Sciences, University of Technology Sydney


