The intergenerational report was sobering, but the reality may be worse
- Written by Rafal Chomik, Senior Research Fellow, ARC Centre of Excellence in Population Ageing Research (CEPAR), UNSW
We’ve had five intergenerational reports now, the first (IGR02) in 2002, and the most recent (IGR21) on Monday.
Each has presented a startling picture of a widening gap between the revenue collected from a declining share of predominantly younger taxpayers and the spending needed on an increasingly older population.
In all but the latest, the financial challenge has got less worse over time.
It has worsened this time because the temporary halt to immigration has for the moment removed one of the tools we have used to slow population ageing and because the COVID crisis meant less economic growth, less growth in tax revenue, and more government spending than we had been expecting.
What’s sobering
Over the next 40 years, the economy and incomes are expected to grow more slowly than in the past, leaving the budget in continual deficit.
This is in part because while needed spending on ageing and health will increase as previously projected, income from taxes will increase only up to a self-imposed cap, reaching it in the 2030s.
But the reality may be worse. The report is optimistic about the rebound to migration, about increases in labour force participation, and about average productivity growth.
If any one of these generous assumptions doesn’t come to pass it will be more difficult than projected to balance the budget as the population ages.
What’s probable
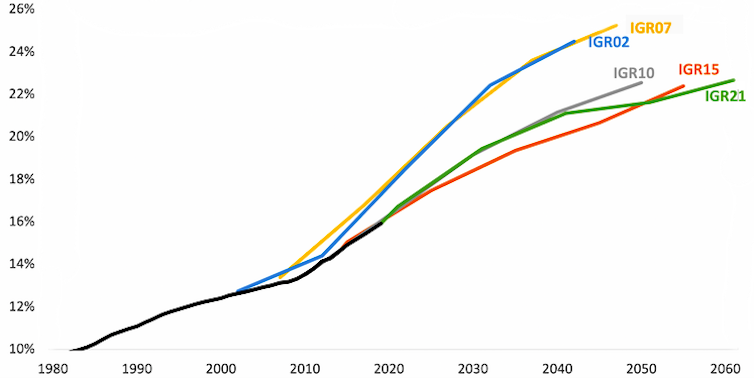
While the demographic fallout from the pandemic is expected to exacerbate population ageing trends, over successive intergenerational reports until now, projections for the proportion of the population aged over 65 have become less pronounced.
Even now, projections for the proportion of the population aged over 65 are tracking those in the 2010 report, but haven’t taken us as far back as the first.
Much will depend on net migration. It is assumed to rebound to 235,000 people per year by 2025, with a revamped focus on skilled migrants. If it gets and stays that high, or climbs, our population will age slowly.
Proportion of population over 65, actual (black) and projected
 Author’s analysis of ABS and Treasury data
What’s possible
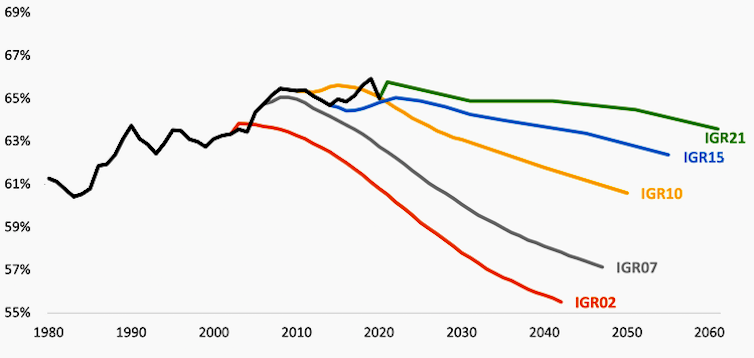
In each intergenerational report so far a greater proportion of the population has been making itself available for paid work than previously expected.
Since 2002, the labour force has grown by 41%. Nearly half of that increase was workers over the age of 50.
There are now a million more women over 50 in the labour force than at the time of the first intergenerational report, and the participation rate of women aged 60-64 had doubled.
Read more:
Intergenerational reports ought to do more than scare us — they ought to spark action
But increases in older-age participation are slowing even though each new cohort of older Australians is healthier, more educated, and more employable.
Research shows if older people are to thrive and prosper in the labour market as the treasury’s figures suggest, Australia will need to dismantle barriers related to health, training, discrimination, and work conditions and scale up strategies to help employers recruit and retain older workers.
Proportion of people aged 15+ in the labour force, actual and projected
 Author’s analysis of ABS and Treasury data
What looks over-optimistic
At the launch of the report on Monday, Treasurer Josh Frydenberg quoted economist Paul Krugman that “productivity isn’t everything, but in the long run, it’s almost everything.”
With greater labour productivity (GDP per hour worked) we earn more with the same or less effort, potentially offsetting the economic and fiscal impacts of ageing.
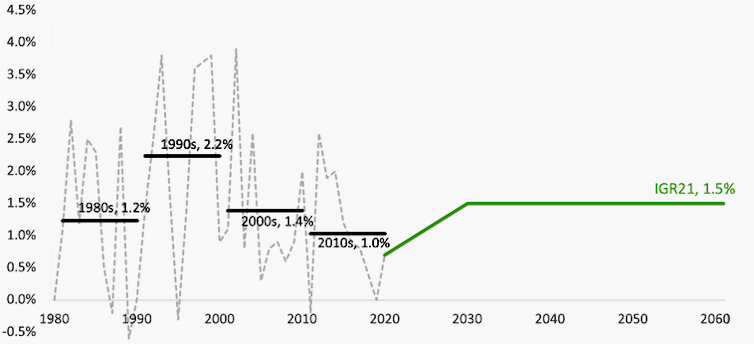
The report’s productivity growth assumption for the next 40 years is based on the average of the last 30 years: 1.5% per year.
Yet recent rates have been much less, and have been declining over time.
Labour productivity annual growth and decade averages, actual and projected
 Change in average GDP per hour worked.
Author’s analysis of ABS and Treasury data
Average annual productivity growth over the last decade, including the pandemic recession, has been 1%.
Treasury’s sensitivity modelling shows that lower than projected productivity growth of 1.2% would see the economy and incomes 9% to 10% lower by 2060-61 and the budget deficit 2.2 percentage points wider.
Australia isn’t alone in experiencing a slowdown in productivity growth and it isn’t clear how much Australia by itself can do about it.
Read more:
Why productivity growth stalled in 2005 (and isn't about to improve)
The report points to a suite of microeconomic reforms related to competition, digital technologies, patents, research and development, and skills, some of which were recommended in a landmark review by the Productivity Commission in 2017.
But as the treasurer pointed out on Monday, many of the big reforms have already been done. As he put it: “you can’t float the dollar twice”.
What’s unmodelled
And a key set of figures are missing from the report — those relating to the impact of climate change.
There is a chapter on the environment describing risks, but it doesn’t feed them into formal projections in the way this month’s NSW intergenerational report did.
Frydenberg’s report is commendable. It presents an opportunity to talk about ways to achieve a better future – not just the one it outlines.
Authors: Rafal Chomik, Senior Research Fellow, ARC Centre of Excellence in Population Ageing Research (CEPAR), UNSW


