From cave art to climate chaos: how a new carbon dating timeline is changing our view of history
- Written by Chris Turney, Professor, Earth Science and Climate Change, UNSW
Geological and archaeological records offer important insights into what seems to be an increasingly uncertain future.
The better we understand what conditions Earth has already experienced, the better we can predict (and potentially prevent) future threats.
But to do this effectively, we need an accurate way to date what happened in the past.
Our research, published today in the journal Radiocarbon, offers a way to do just that, through an updated method of calibrating the radiocarbon timescale.
An amazing tool for perusing the past
Radiocarbon dating has revolutionised our understanding of the past. It is nearly 80 years since Nobel Prize-winning US chemist Willard Libby first suggested minute amounts of a radioactive form of carbon are created in the upper atmosphere.
Libby correctly argued this newly formed radiocarbon (or C-14) rapidly converts to carbon dioxide, is taken up by plants during photosynthesis, and from there travels up through the food chain.
When organisms interact with their environment while alive, they have the same proportion of C-14 as their environment. Once they die they stop taking in new carbon.
Their level of C-14 then halves every 5,730 years due to radioactive decay. An organism that died yesterday will still have a high level of C-14, whereas one that died tens of thousands of years ago will not.
By measuring the level of C-14 in a specimen, we can deduce how long ago that organism died. Currently, with this method, we can date remains up to 60,000 years old.
Read more: Explainer: what is radiocarbon dating and how does it work?
A seven-year effort
If the level of C-14 in the atmosphere had always been constant, radiocarbon dating would be straightforward. But it hasn’t.
Changes in the carbon cycle, impinging cosmic radiation, the use of fossil fuels and 20th century nuclear testing have all caused large variations over time. Thus, all radiocarbon dates need to be adjusted (or calibrated) to be turned into accurate calendar ages.
Without this adjustment, dates could be out by up to 10-15%. This week we report a seven-year international effort to recalculate three radiocarbon calibration curves:
- IntCal20 (“20” to signify this year) for objects from the northern hemisphere
- SHCal20 for samples from the ocean-dominated southern hemisphere
- Marine20 for samples from the world’s oceans.
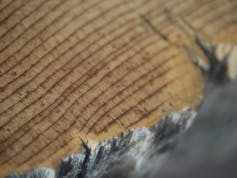
 We dated bristlecone pine tree rings from the second millennium BC.
P. Brewer/Uni of Arizona
We constructed these updated curves by measuring a plethora of materials that record past radiocarbon levels, but which can also be dated by other methods.
Included in the archives are tree rings from ancient logs preserved in wetlands, cave stalagmites, corals from the continental shelf and sediments drilled from lake and ocean beds.
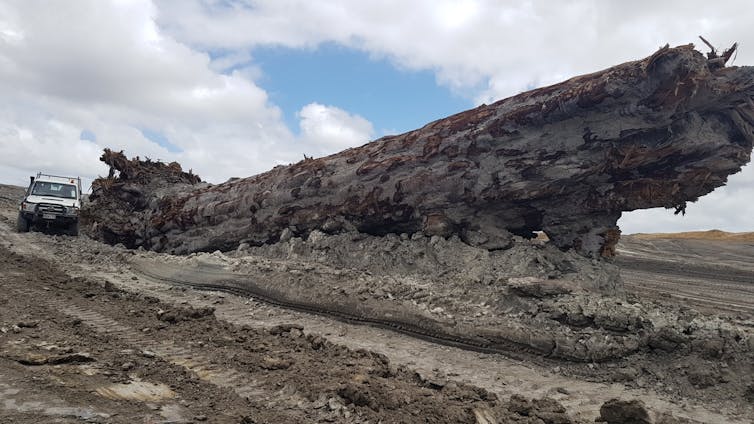
 Ancient New Zealand kauri (Agathis australis) logs like this example were used to help construct the calibration curves. This tree is about 40,000 years old and was found buried underground.
Nelson Parker
In total, the new curves are based on almost 15,000 radiocarbon measurements taken from objects up to 60,000 years old.
Advances in radiocarbon measurement using accelerator mass spectrometry mean the updated curves can use very small samples, such as single tree rings from just one year’s growth.
 Stalagmites from inside the Hulu Cave in China were key to estimating the amount of radiocarbon present in objects between 14,000 and 55,000 years old.
Hai Cheng, Author provided
Reassessing old beliefs
The new radiocarbon calibration curves provide previously impossible precision and detail. As a result, they greatly improve our understanding of how Earth has evolved and how these changes impacted its inhabitants.
One example is the rate of environmental change at the end of the most recent ice age. As the world started to warm some 18,000 years ago, vast ice sheets covering Antarctica, North America (including Greenland) and Europe melted – returning huge volumes of fresh water to the oceans.
But the sea level didn’t rise at a consistent rate like the global temperature. Sometimes it was gradual and other times extremely rapid.
A prime location to detect past sea levels is the Sunda Shelf, a large platform of land that was once part of continental Southeast Asia.
One study published in 2000 showed mangrove plant remains found on the seabed recorded a catastrophic 16-metre sea level rise over several hundred years (about half a metre each decade). This event, known as Meltwater Pulse-1A, flooded the Sunda Shelf.
Our latest work has modified this story considerably. The new calibration curves reveal this extreme phase of sea level rise actually began 14,640 years ago and lasted just 160 years.
This equates to a staggering one-metre rise each decade – a sobering lesson for the future, considering the current much lower projected changes for the end of this century.
An extra half a millennium of art
Going further back in time, we also looked at some of the world’s oldest cave art in France’s Chauvet Cave, first discovered in 1994.
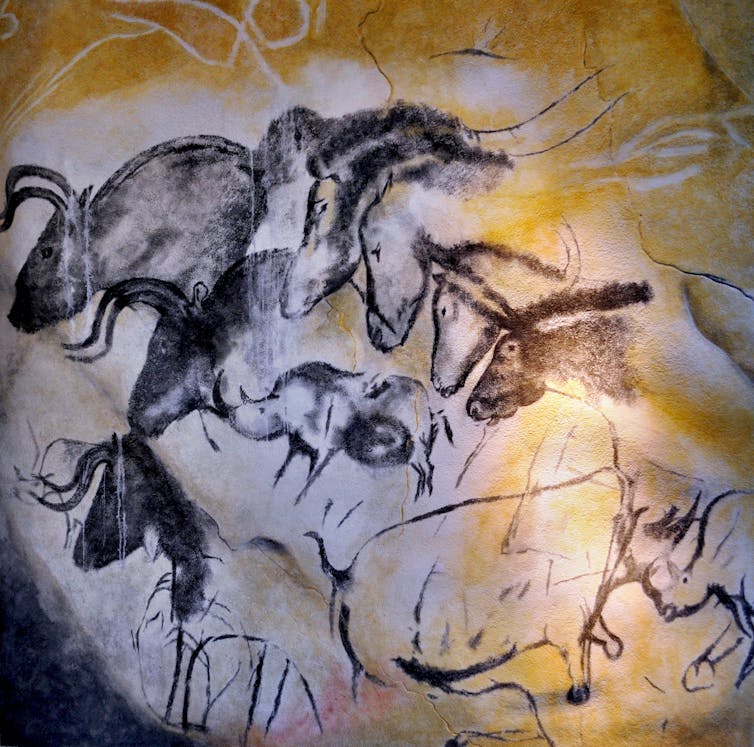
This cave contains hundreds of beautifully preserved paintings. They depict a European menagerie with long-extinct mammoths, cave lions and woolly rhinoceroses, captured in real-life scenes that provide a window into a lost world.
The Chauvet Cave reveals the artistic sophistication of our early ancestors in phenomenal detail.
 The Chauvet Cave contains hundreds of cave paintings created more than 30,000 years ago.
Thomas T/flickr
With the new IntCal20 curve, our best estimate for the creation of the oldest radiocarbon-dated painting in the cave is now 36,500 years ago. This is almost 450 years older than previously thought.
These are just two of many more examples of the far-reaching impact our latest work will have.
As the new calibration curves are used to re-analyse ages of a host of archaeological and geological records, we can expect major shifts in our understanding of the planet’s past – and hopefully, a better forecast into its future.
Read more: Is that rock hashtag really the first evidence of Neanderthal art?
Authors: Chris Turney, Professor, Earth Science and Climate Change, UNSW


